

Summary
New characteristics for the assessment of malnutrition in adult patients, including energy intake, weight loss, subcutaneous fat and muscle mass loss, fluid accumulation, and grip strength are applicable to intensive care unit patients. Malnutrition in these patients, including critically ill obese patients, is associated with increased mortality.
- malnutrition
- nutrition
- therapy
- obesity
- ICU
- critically ill
- assessment
- mortality
- recommendations
Kris M. Mogensen, MS, RD, LDN, CNSC, Brigham and Women’s Hospital, Boston, Massachusetts, USA, focused on the practical aspects of applying etiology-based malnutrition characteristics to critically ill patients. She discussed challenges incurred in the nutrition assessment of intensive care unit (ICU) patients and evaluation of patients using the new assessment criteria.
The tools traditionally used for nutrition assessment (albumin, prealbumin, anthropometry) are not validated in critical care. Yet, ICU patients require nutrition assessment, including evaluation of weight loss and nutrient intake prior to admission, disease severity, comorbid conditions, and gastrointestinal tract function [McClave SA et al. JPEN J Parenter Enteral Nutr. 2009]. Malnutrition in most ICU patients is due to chronic disease or acute disease or injury, which is characterized by mild to moderate inflammation or marked inflammation, respectively. The proposed Academy of Nutrition and Dietetics and American Society for Parenteral and Enteral Nutrition (A.S.P.E.N.) characteristics for identifying malnutrition in patients with chronic or acute disease are shown in Table 1 [White JV et al. JPEN J Parenter Enteral Nutr. 2012].
Academy of Nutrition and Dietetics and A.S.P.E.N. Characteristics for Identification of Adult Malnutrition
The physical assessment can evaluate nutrition status by looking for signs and symptoms of deficiencies, including evidence of skin breakdown and easily pluckable hair. Biochemical evaluation can identify some micronutrient deficiencies, such as vitamin deficiencies.
The proposed adult malnutrition characteristics can be applied in the ICU. According to Mogensen, more validated tools and resources are needed to optimize the physical examination in these patients, particularly for the degrees of muscle wasting and subcutaneous fat loss. Although micronutrient evaluation is not one of the characteristics, it is important to include in the clinical assessment.
Assessing critically ill patients who are obese can be a challenge. The results of studies on the impact of obesity on clinical outcomes have been inconsistent [Choban P et al. JPEN J Parenter Enteral Nutr. 2013]. Malcolm K. Robinson, MD, Brigham and Women’s Hospital, Boston, Massachusetts, USA, hypothesized that the reason for these disparate findings is a lack of control for nutritional status.
A single-center, registry-based observational cohort study by Dr Robinson et al. [Crit Care Med. 2015] including 6518 obese critically ill patients who were formally evaluated by a registered dietitian found that malnourished vs well-nourished obese patients had a significantly higher risk for mortality (Figure 1). These results support nutritional assessment of obese critically ill patients and nutritional support for those who are malnourished.
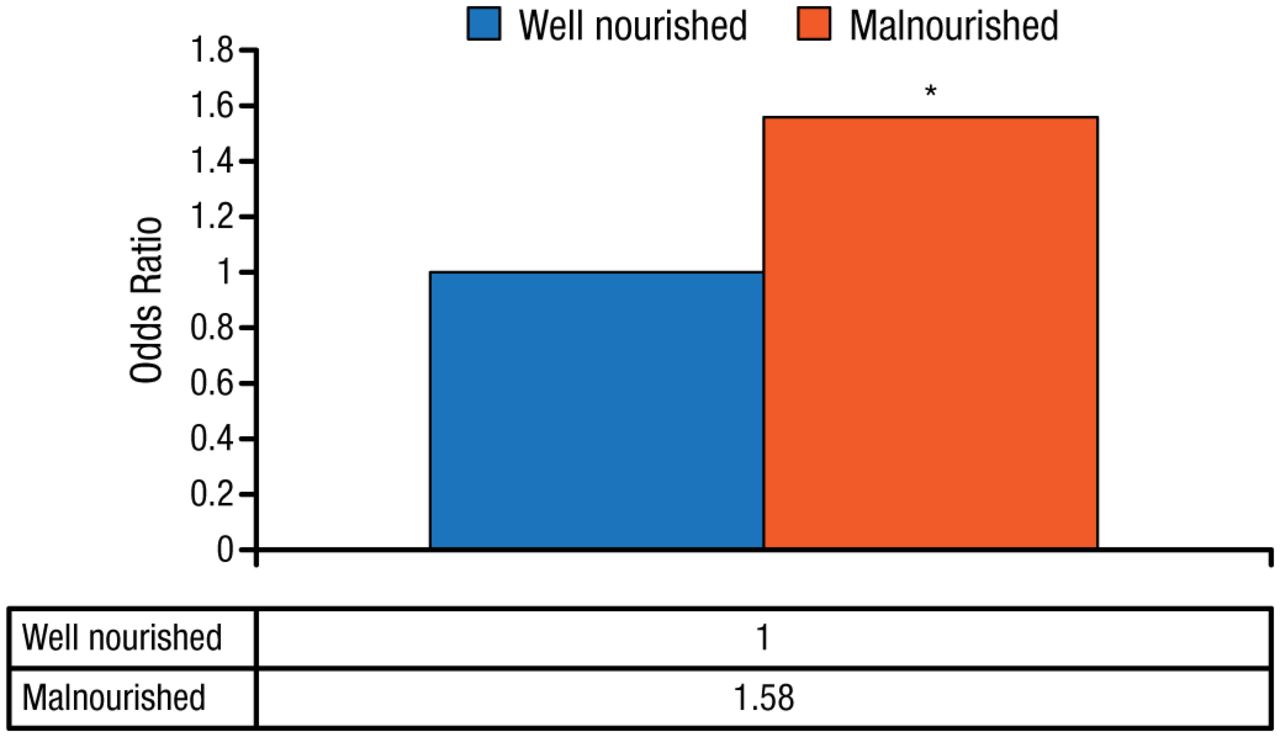
Adjusted Odds Ratio for 30-Day Mortality in Obese Critically Ill Patients
*P = .001 vs well nourished.
Source: Robinson MK et al. Crit Care Med. 2015.
Reproduced with permission from A.S.P.E.N.
The A.S.P.E.N. clinical guidelines recommend screening all hospitalized patients, regardless of body mass index (BMI) for nutritional risk within 48 hours of admission [Choban P et al. JPEN J Parenter Enteral Nutr. 2013]. A.S.P.E.N. recommendations for nutrition assessment and support in obese patients at risk are shown in Table 2.
A.S.P.E.N. Recommendations for Nutrition Assessment and Support in Obese Critically Ill Patients
A study evaluating the A.S.P.E.N. recommendations for caloric provision in critically ill obese patients assessed 4 predictive resting energy expenditure (PREE) equations for validity: the A.S.P.E.N.-Actual (12.5 kcal/kg actual weight); A.S.P.E.N.-Ideal (23.5 kcal/kg ideal body weight); Harris-Benedict (using adjusted weight and 1.5 stress factor × 0.65); and Ireton-Jones (for obesity × 0.65) equations [Mogensen KM et al. A.S.P.E.N. 2011 (abstr S31-4)].
The evidence shows that obese critically ill patients are at risk for nutritionally related poor outcomes and have the same indications for nutrition intervention as nonobese patients. The Penn State University (PSU) formula is best for estimating eucaloric needs in obese ICU patients who are mechanically ventilated when indirect calorimetry is unavailable. Further research is needed to determine if hypocaloric feeding benefits obese ICU patients and to determine and validate which predictive formulas are best.
Edward Saltzman, MD, Tufts University, Boston, Massachusetts, USA, defined hypocaloric feeding as an energy deficit with adequate protein and permissive underfeeding as energy and protein deficits. A study of 158 ICUs found substantial gaps between nutrition therapy guidelines and actual practice, with an average of about 60% of calorie needs received across the sites [Cahill NE et al. Crit Care Med. 2010]. The rationale for underfeeding includes avoiding overfeeding and the related risks, while maintaining the patient’s lean body mass and functional status. Patients may also be underfed to avoid complications and costs related to the addition of parenteral nutrition (PN) to enteral nutrition (EN) that is not appropriately managed.
Indirect calorimetry is preferred for initial measurement of energy needs, but many ICUs do not have this technology. Energy needs can be estimated by prediction equations, anthropometrics, clinical parameters, and evaluating diagnoses and comorbidities. The energy prescription should be re-evaluated periodically based on the clinical course, biochemical indicators, and duration of critical illness.
A study comparing 160 variations of 13 prediction equations with indirect calorimetry found that 38% underestimated and 12% overestimated energy expenditure by > 10% [Tatuco-Babet OA et al. JPEN J Parenter Enteral Nutr. 2015]. The statistical method used to interpret the association between the amount of calories and mortality significantly influenced the results in a study by Heyland DK et al. [Crit Care Med. 2011]. The initial analysis including all days in the ICU found a significant association between increased caloric intake and increased 60-day mortality (OR, 1.28; 95% CI, 1.12 to 1.48). When the days after oral intake were excluded, the provided energy had no effect on mortality (unadjusted analysis: OR, 1.04; 95% CI, 0.90 to 1.20). In patients with ≥ 4 days in the ICU prior to oral intake, excluding the days after starting oral intake resulted in reduced mortality with increased caloric intake (unadjusted OR, 0.73; 95% CI, 0.63 to 0.85).
Other studies have provided inconsistent results on the benefit of adding EN to PN to improve mortality, length of stay, or ventilator days; early PN alone; and when to supplement PN to prevent accumulated energy deficit [Harvey SE et al. N Engl J Med. 2014; Doig GS et al. JAMA. 2013; Heidegger CP et al. Lancet. 2013; Casaer MP et al. N Engl J Med. 2011]. Heyland DK et al. [Crit Care. 2011] developed a risk assessment tool to identify critically ill patients who benefit most from nutrition therapy. As the nutrition risk score increased, there was a linear increase in mortality at 28 days, and logistic regression showed that adequate nutrition modified the association between the score and mortality at 28 days (P = .01).
Because optimal energy targets for critically ill patients are not known, a prudent approach to nutrition therapy is warranted, with initial moderate feeding and subsequent full feeding. The role of protein is not clearly defined, and it is unclear when PN should be added in patients who are unable to receive or tolerate goal EN. Studies are needed to identify subgroups that would benefit from early, full feeding.
Kenneth B. Christopher, MD, Brigham and Women’s Hospital, Boston, Massachusetts, USA, and colleagues investigated outcomes in malnourished critically ill patients. This prospective study, which is currently unpublished, included 4467 ICU patients who were evaluated by a registered dietitian between 2004 and 2012. The nutrition evaluation included anthropometric data, physical examination, diet history or recent energy and protein intake, and biochemical markers. The primary and secondary end points were 30- and 90-day mortality, respectively.
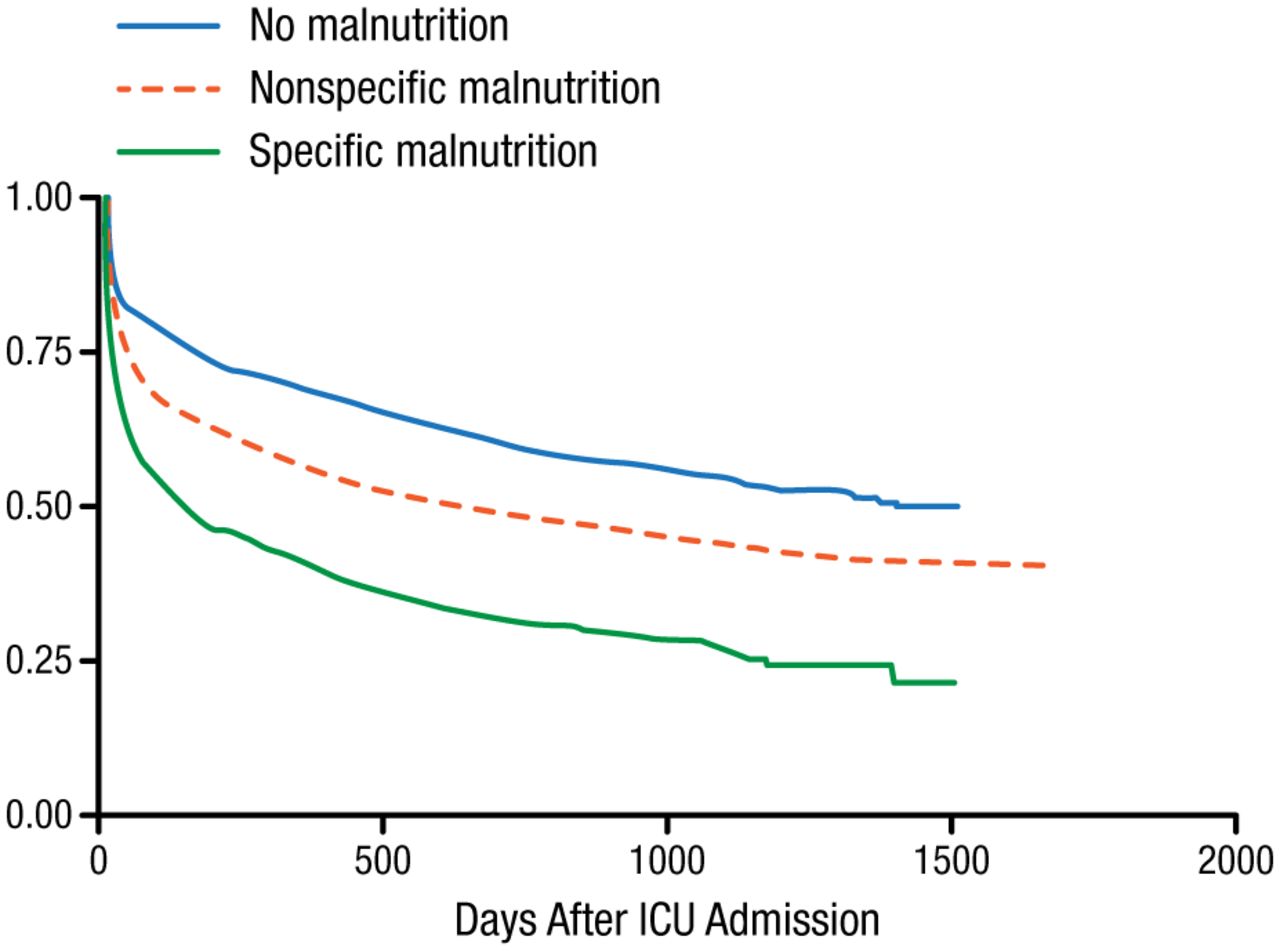
Nutrition assessment revealed that 39% of patients were not malnourished, 49% had nonspecific malnutrition, and 12% had specific protein-calorie malnutrition. Malnourished patients had significantly higher Deyo-Charlson index, more septic episodes, more use of inotropes or vasopressors, and more acute kidney injury (χ2 P < .001 for all). The 30- and 90-day mortality rates were 17.3% and 21.4% in patients with no malnutrition, 23.7% and 32.4% in patients with nonspecific malnutrition, and 32.2% and 45.5% in those with specific malnutrition (P < .001 for both). The Kaplan-Meier survival estimates are shown in Figure 2.

Kaplan-Meier Survival Estimates
ICU, intensive care unit.
Reproduced with permission from A.S.P.E.N.
Nutrition status was predictive for 30- and 90-day mortality (Table 3). The adjusted odds of 30- and 90-day mortality were OR, 1.60 (95% CI, 1.27 to 2.02) and OR, 1.59 (95% CI, 1.36 to 1.87) in patients with nonspecific malnutrition and OR, 2.68 (95% CI, 1.99 to 3.59) and OR, 2.98 (95% CI, 2.40 to 3.69) in patients with specific malnutrition compared with patients with no malnutrition (P < .001 for all).
Nutrition Status and Functional Status at Discharge: 90-Day Postdischarge Mortality Rate
The 90- and 365-day postdischarge mortality rates (n = 3563) were 9.9% and 19.3% in patients with no malnutrition, 16.3% and 28.4% in patients with nonspecific malnutrition, and 28.2% and 45.2% in those with specific malnutrition (P < .001 for all). Table 3 shows the 90-day postdischarge mortality rates according to nutrition status and functional status at discharge. Results based on 5000 bootstrapped samples in a nonparametric bootstrapping analysis indicated that functional status significantly mediated the relationship between nutrition status and 90-day postdischarge mortality.
Dr Christopher also investigated 308 metabolite signatures of ICU patients (n = 90) related to nutritional status. The unpublished study shows that malnourished patients had a significantly higher risk of 28-day mortality compared with patients with no malnutrition (adjusted OR, 3.26; 95% CI, 1.15 to 9.19; P < .026). The metabolite profiles differed significantly in critically ill patients according to nutrition status. The addition of 5 metabolites to a model for discrimination of malnutrition status and 3 metabolites to a model for discrimination of 28-day mortality improved the discrimination of the models for both parameters.
In a large population of critically ill adults, malnutrition near ICU admission was a robust predictor of mortality. A causal relationship between nutrition status and outcomes cannot be inferred from these data alone. Other unmeasured variables may influence outcomes independently of nutrition status, which may have biased estimates. Potential residual confounding of unmeasured variables may also exist.
- © 2015 SAGE Publications
Tools


Table of contents
Cited By...
- No citing articles found.