

Summary
The sodium glucose cotransporter 2 inhibitor canagliflozin is associated with durable glycemic improvement over 104 weeks compared with glimepiride in patients with type 2 diabetes mellitus (T2DM) on background metformin therapy. Such was the primary finding of a Phase 3 randomized, double-blind efficacy and safety study.
- Hyperglycemia/Hypoglycemia
- Diabetes & Endocrinology Clinical Trials
- Diabetes Mellitus
- Hyperglycemia/Hypoglycemia
- Diabetes & Endocrinology Clinical Trials
- Endocrinology
- Diabetes & Metabolic Syndrome
- Diabetes Mellitus
The sodium glucose cotransporter 2 inhibitor canagliflozin is associated with durable glycemic improvement over 104 weeks compared with glimepiride in patients with type 2 diabetes mellitus (T2DM) on background metformin therapy. Such was the primary finding of a Phase 3 randomized, double-blind efficacy and safety study presented by Gisle Langslet, MD, Lipid Clinic, Oslo University Hospital, Oslo, Norway.
A previous Phase 3 study had demonstrated that canagliflozin 100 mg/day was noninferior to glimepiride (mean maximum dose 5.6 mg) and canagliflozin 300 mg/day was superior to glimepiride in lowering levels of HbA1C in patients with T2DM on background metformin over 52 weeks; both doses of canagliflozin were associated with reductions in body weight compared with glimepiride [Cefalu WT et al. Lancet 2013].
The 104-week study represents the longest follow-up of canagliflozin treatment to date, said Prof. Langslet. It compared canagliflozin with glimepiride in patients with T2DM inadequately controlled on metformin monotherapy. Patients with HbA1C ≥7.0% and ≤9.5% were randomized after a 2-week placebo run-in to canagliflozin 100 or 300 mg/day, or glimepiride up to 8 mg/day during the 52-week core period (n=1450), followed by a 52-week extension (n=1050). The mean duration of diabetes was 6.6 years. At baseline, patients' mean age was 56.2 years, their mean HbA1C was 7.8%, their mean fasting plasma glucose (FPG) was 9.2 mmol/L, and their mean body mass index was 31.0 kg/m2.
The rate of rise per year in HbA1C from Week 26 to Week 104 was lower with canagliflozin 100 and 300 mg than with glimepiride (0.16%, 0.16%, and 0.37%, respectively). The mean change in FPG from baseline to Week 104 was −0.6 mmol/L with glimepiride compared with −1.1 mmol/L with canagliflozin 100 mg, and −1.3 mmol/L with canagliflozin 300 mg. Body weight increased from baseline to Week 104 by 0.9% in the glimepiride group and decreased by 4.1% and 4.2% in the groups randomized to canagliflozin 100 mg and 300 mg, respectively. The weight changes were maintained over the 52-week extension period.
Systolic blood pressure increased by 1.7 mm Hg from baseline to Week 104 in the glimepiride group but declined by 2.0 and 3.1 mm Hg with canagliflozin 100 and 300 mg, respectively. Both canagliflozin doses were associated with increases in high-density lipoprotein cholesterol (HDL-C) and low-density lipoprotein cholesterol (LDL-C) that were stable from Week 26 to Week 104. Increases in LDL-C and HDL-C were smaller in patients randomized to glimepiride relative to canagliflozin, and these increases were also stable from Week 26.
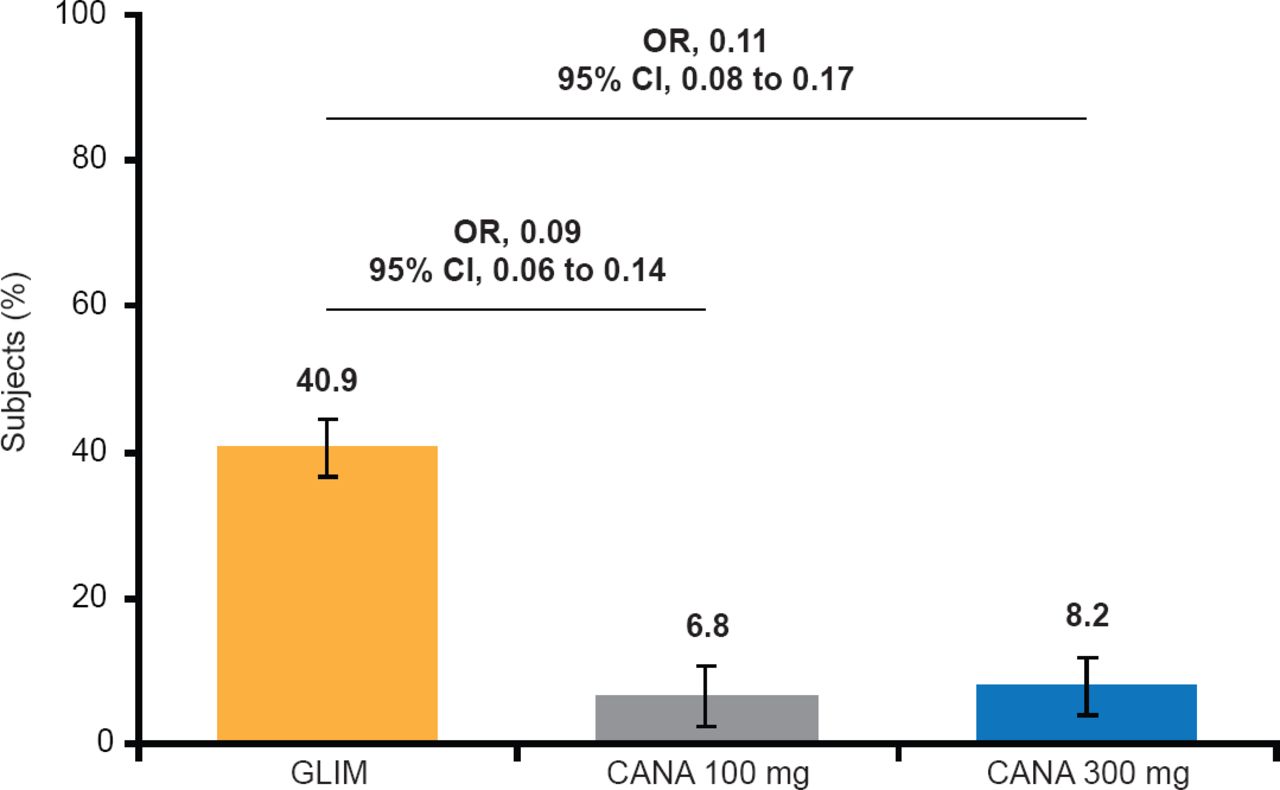
Fewer subjects had hypoglycemic events with either dose of canagliflozin than with glimepiride (Figure 1).

Documented Hypoglycemic Episodes*
*Includes episodes that were biochemically documented (≤3.9 mmol/L) or severe (ie, requiring the assistance of another individual or resulting in seizure or loss of consciousness).
Reproduced with permission from G Langslet, MD.
The incidences of adverse events were 73.3%, 77.9%, and 78.4% with canagliflozin 100 mg and 300 mg and glimepiride, respectively. The incidences of serious adverse events were 9.7%, 9.7%, and 14.3% in the three groups, respectively. The rates of genital mycotic infection rates were higher in the canagliflozin groups than in the glimepiride group (Table 1). Higher rates of osmotic diuresis-related adverse events and urinary tract infections were observed with canagliflozin compared with glimepiride.
Incidence of Selected Adverse Events
A larger decrease in estimated glomerular filtration rate was observed with glimepiride (6.2 mL/min/1.73 m2) than with canagliflozin 100 and 300 mg (2.0 and 3.8 mL/min/1.73 m2, respectively) at Week 104.
- © 2013 MD Conference Express®
Tools


Table of contents
Cited By...
- No citing articles found.