

Article Figures & Data
Figures
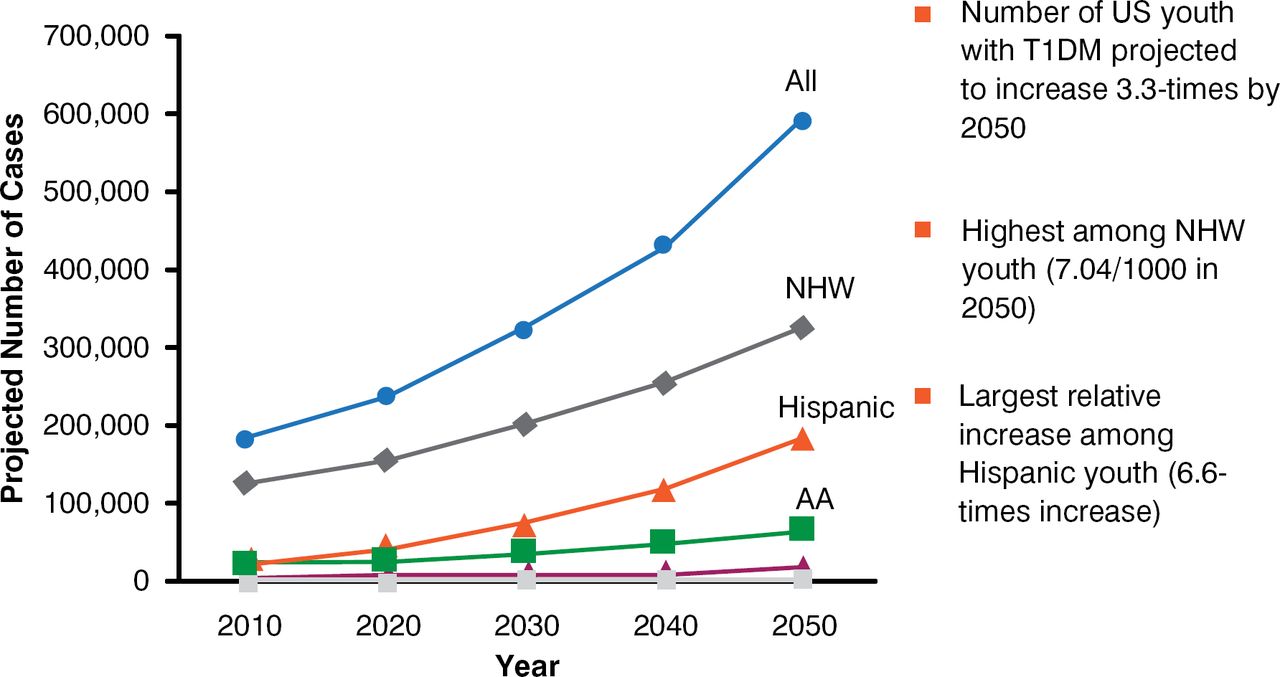
- Figure 1.
Projected Number of Youth With Type 1 Diabetes Among U.S. Youth < 20 Years, by 2050
AA = African American; NHW = non-Hispanic white; T1DM = type 1 diabetes mellitus; US = United States.
Source: Imperatore G et al. Diabetes Care 2012.
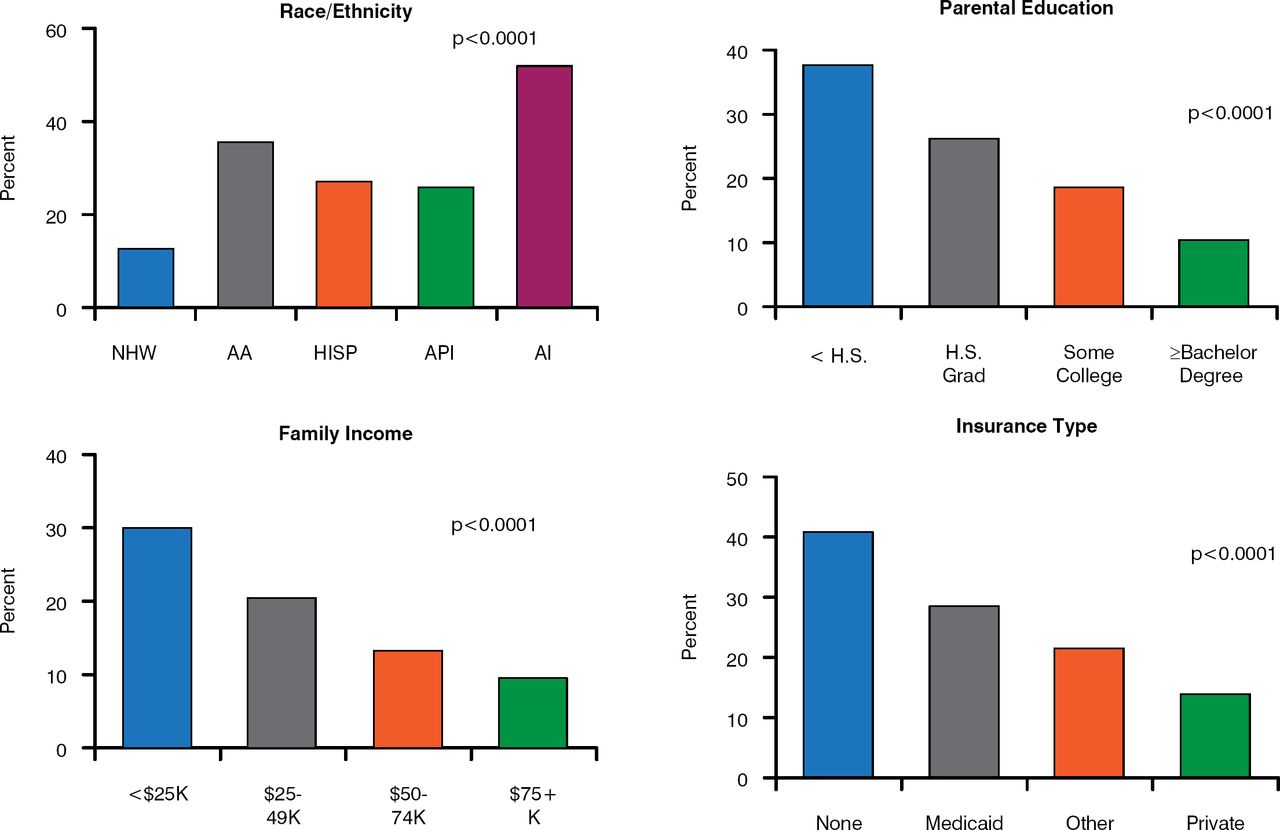
- Figure 2.
Risk Factors for Poor Glycemic Control
AA = African American; AI = American Indian; API = Asian Pacific Islander; Hisp = Hispanic; H.S. = high school; Grad = graduated; NHW = non-Hispanic white.
Source: Petitti DB et al. J Pediatr 2009.
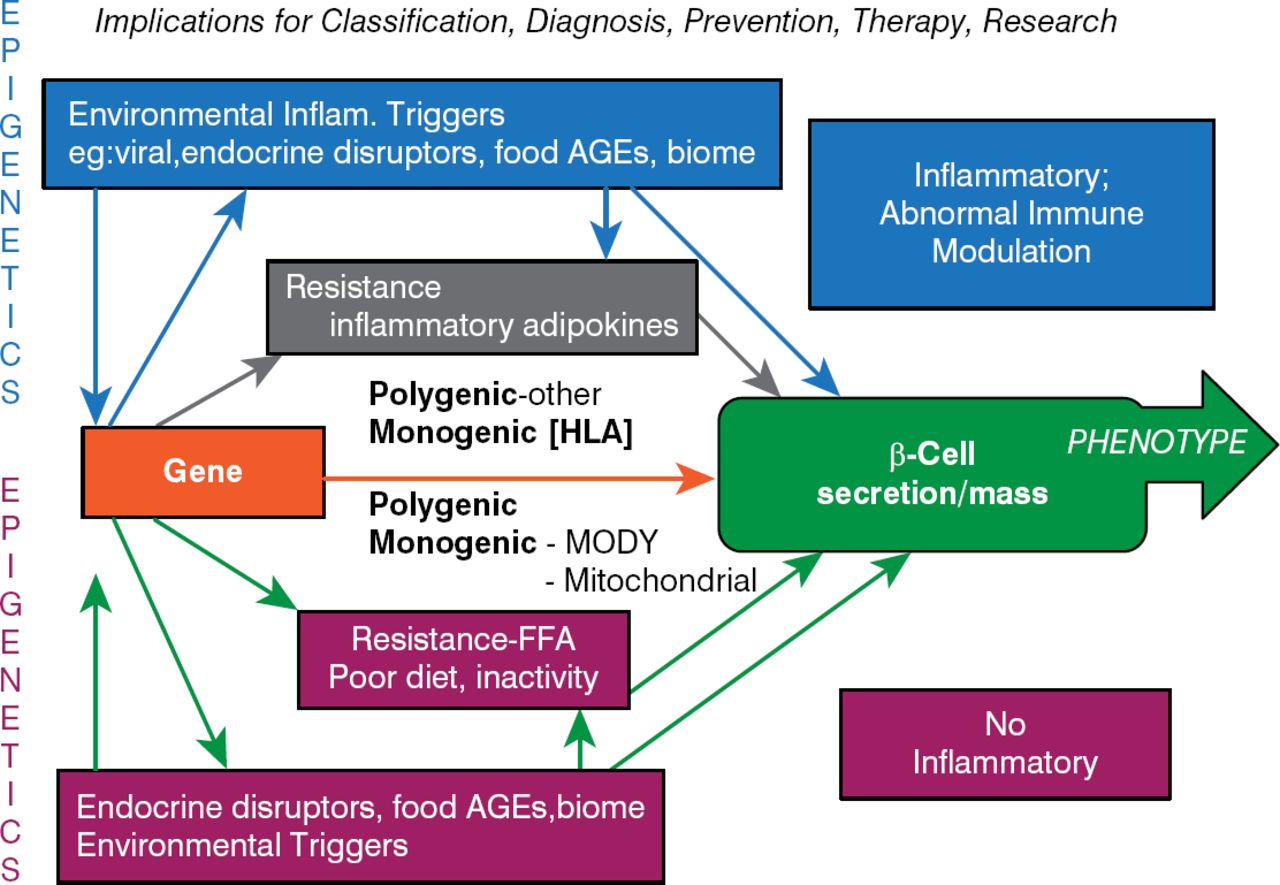
- Figure 3.
Pathogenic β-Cell-Centric Construct for Diabetes
AGE = advanced glycation end product; FFA = free fatty acids; HLA = human leukocyte antigen; Inflam = inflammation; MODY = maturity-onset diabetes of the young.
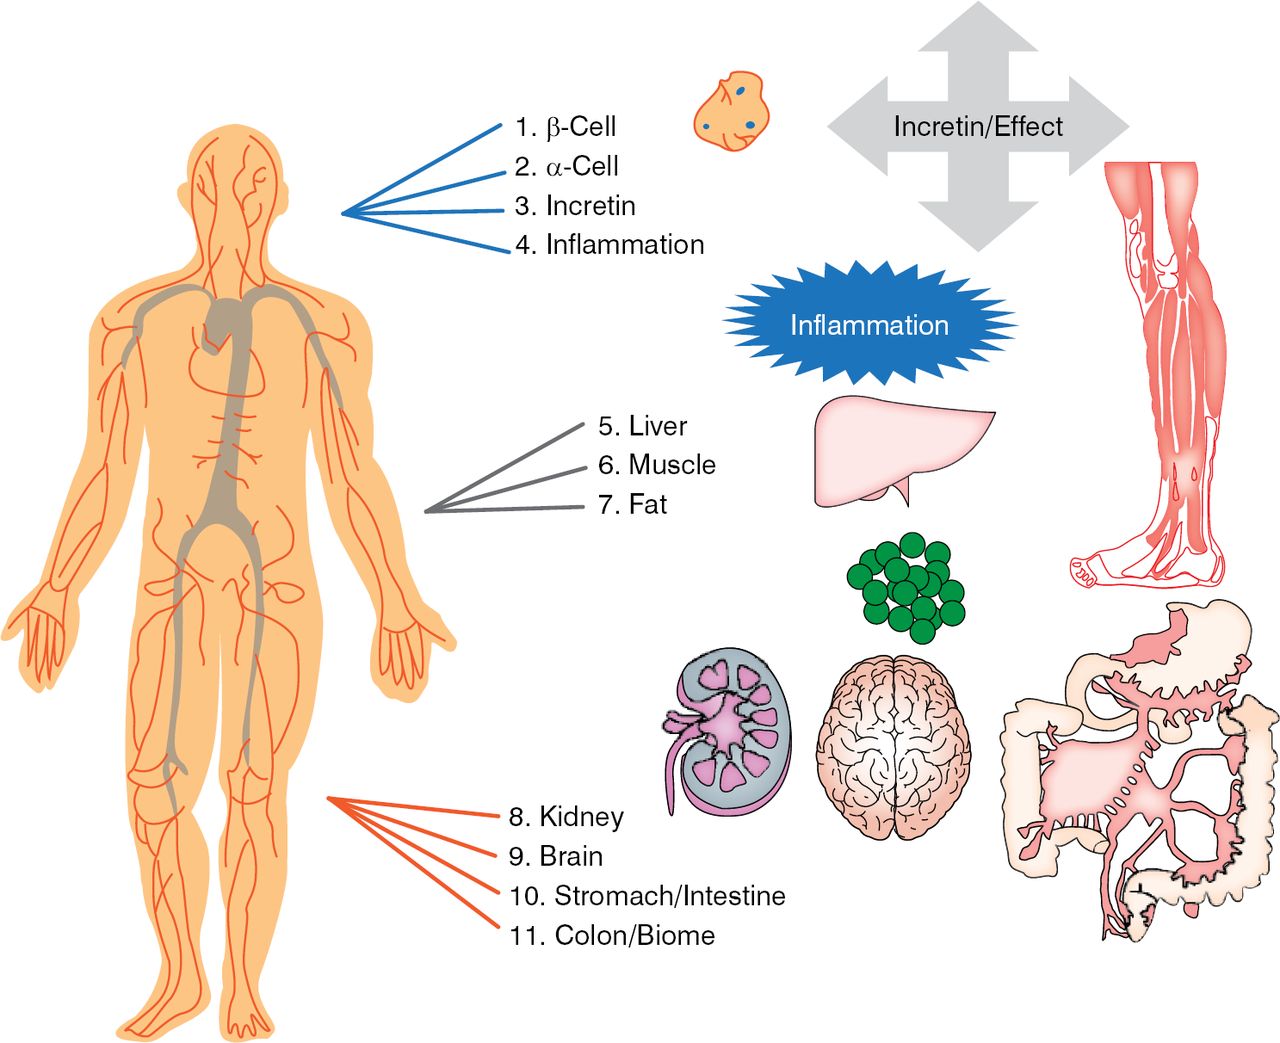
- Figure 4.
Eleven Targets for Diabetes Treatment
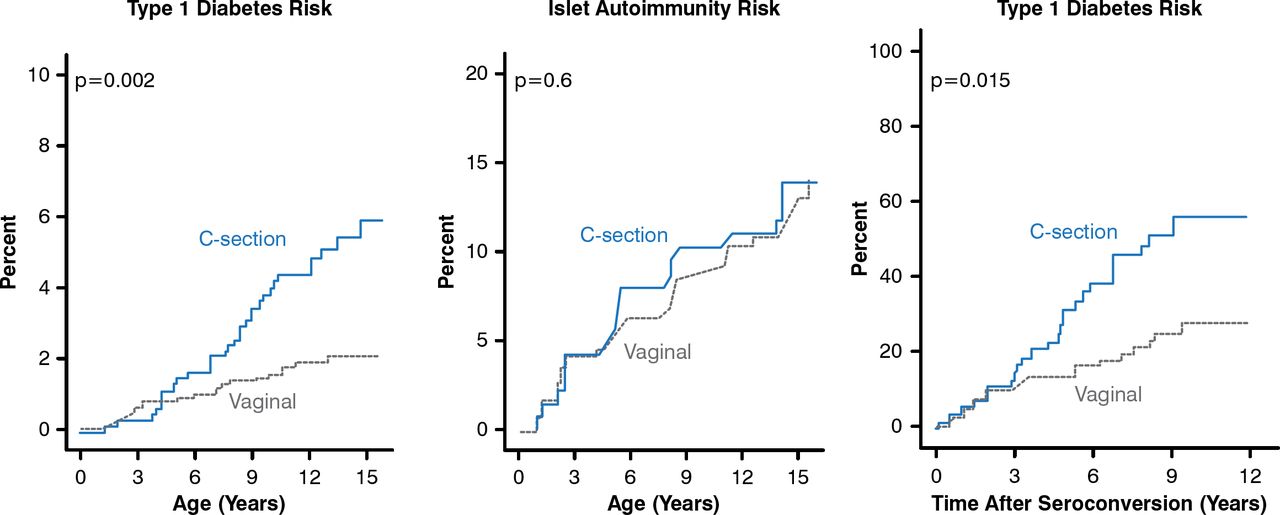
- Figure 5.
Progression to Type 1 Diabetes in Children Born by Cesarean Versus Vaginal Delivery
Reproduced from Bonifacio et al. Cesarean Section and Interferon-Induced Helicase Gene Polymorphisms Combine to Increase Childhood Type 1 Diabetes Risk. Diabetes 20;60:3300–3306. With permission from the American Diabetes Association.


Tools


Table of contents
Cited By...
- No citing articles found.