

Article Figures & Data
Figures
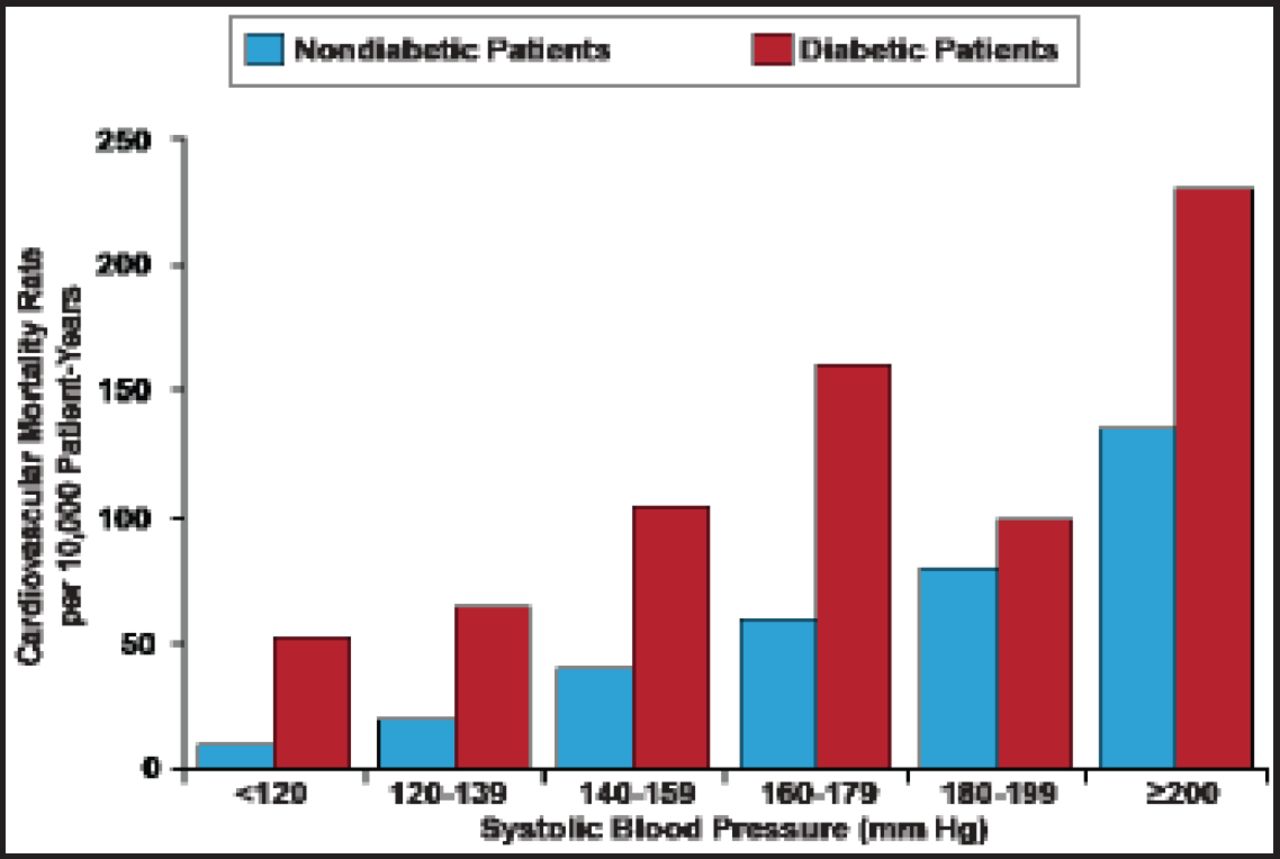
- Figure 1.
Elevated Systolic BP in Type 2 Diabetes Increases Cardiovascular Risk.
Stamler J et al. Diabetes, other risk factors, and 12-yr cardiovascular mortality for men screened in the Multiple Risk Factor Intervention Trial. Diabetes Care. 1993;16(2):434–44.
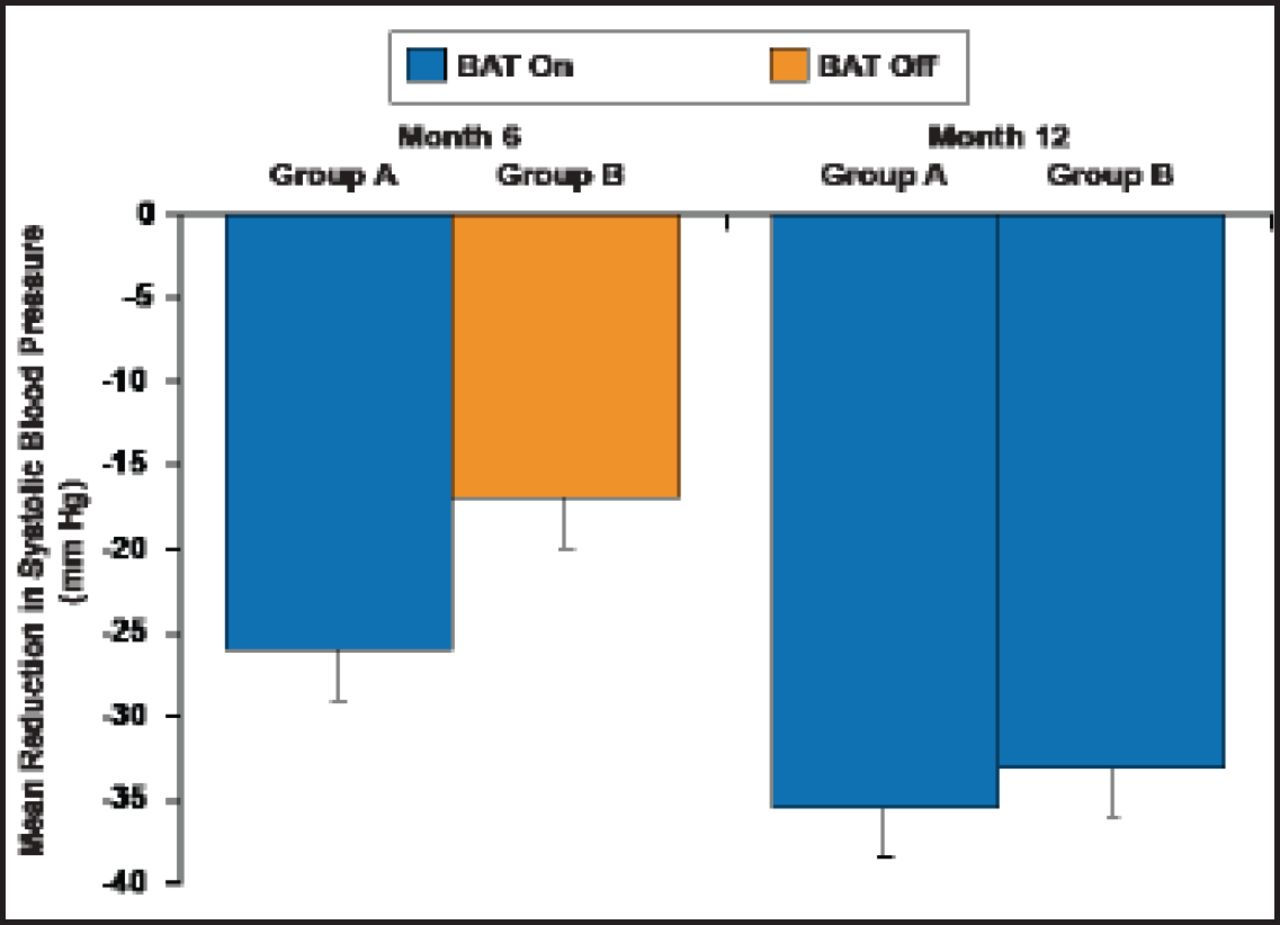
- Figure 2.
Observed Mean Change in Systolic BP.
BAT=baroreflex activation therapy.
Bisognano JD et al. Baroreflex activation therapy lowers blood pressure in patients with resistant hypertension. J Am Coll Cardiol. 2011;58(7):765–73.
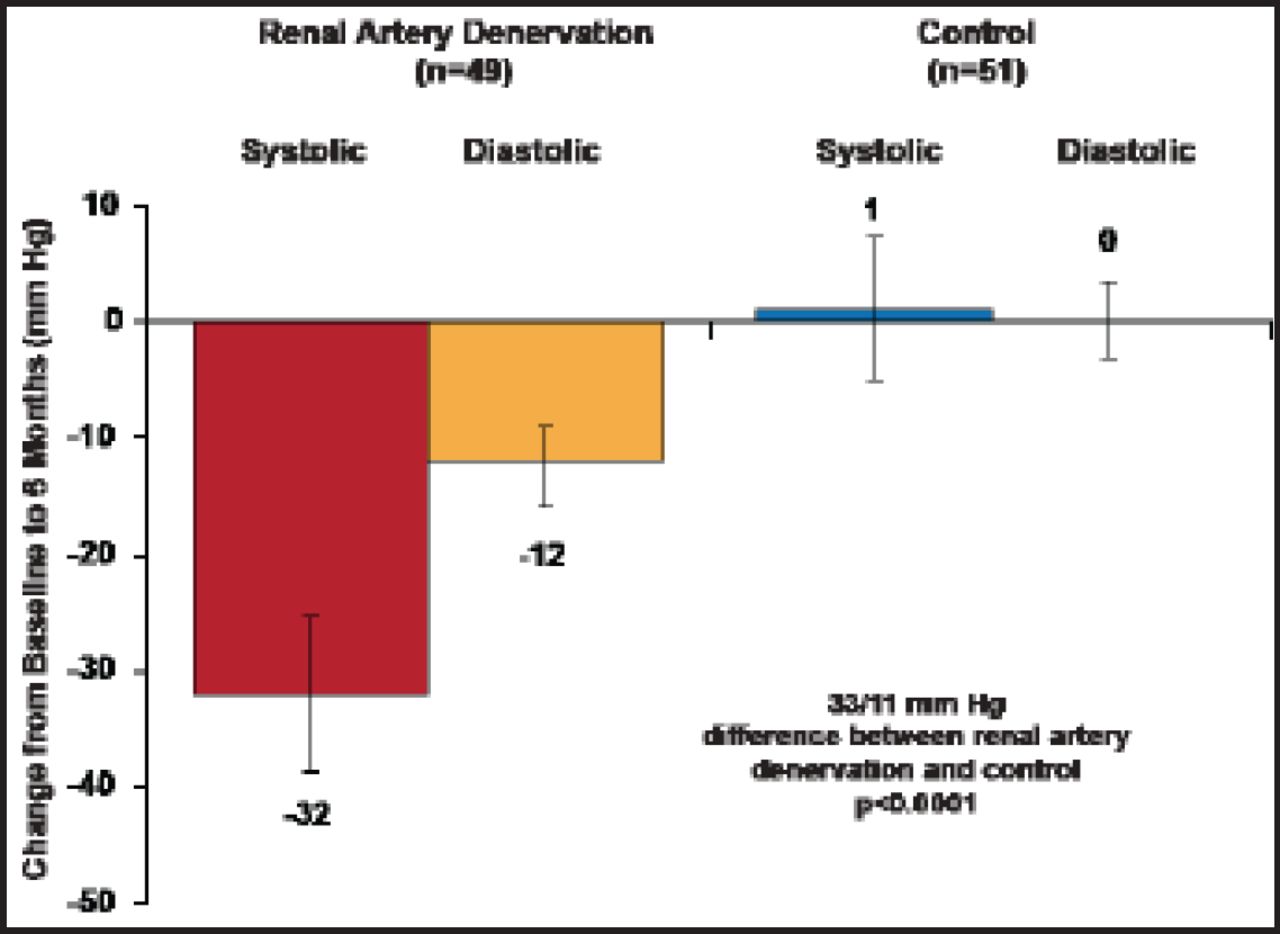
- Figure 3.
Primary Endpoint: 6-Month Office BP.
Reproduced with permission from The Lancet; Symplicity HTN-2 Investigators. Renal sympathetic denervation in patients with treatment-resistant hypertension (The Symplicity HTN-2 Trial): A randomised controlled trial. 2010;376(9756):1903–9.


Tools


Table of contents
Cited By...
- No citing articles found.