

Article Figures & Data
Figures
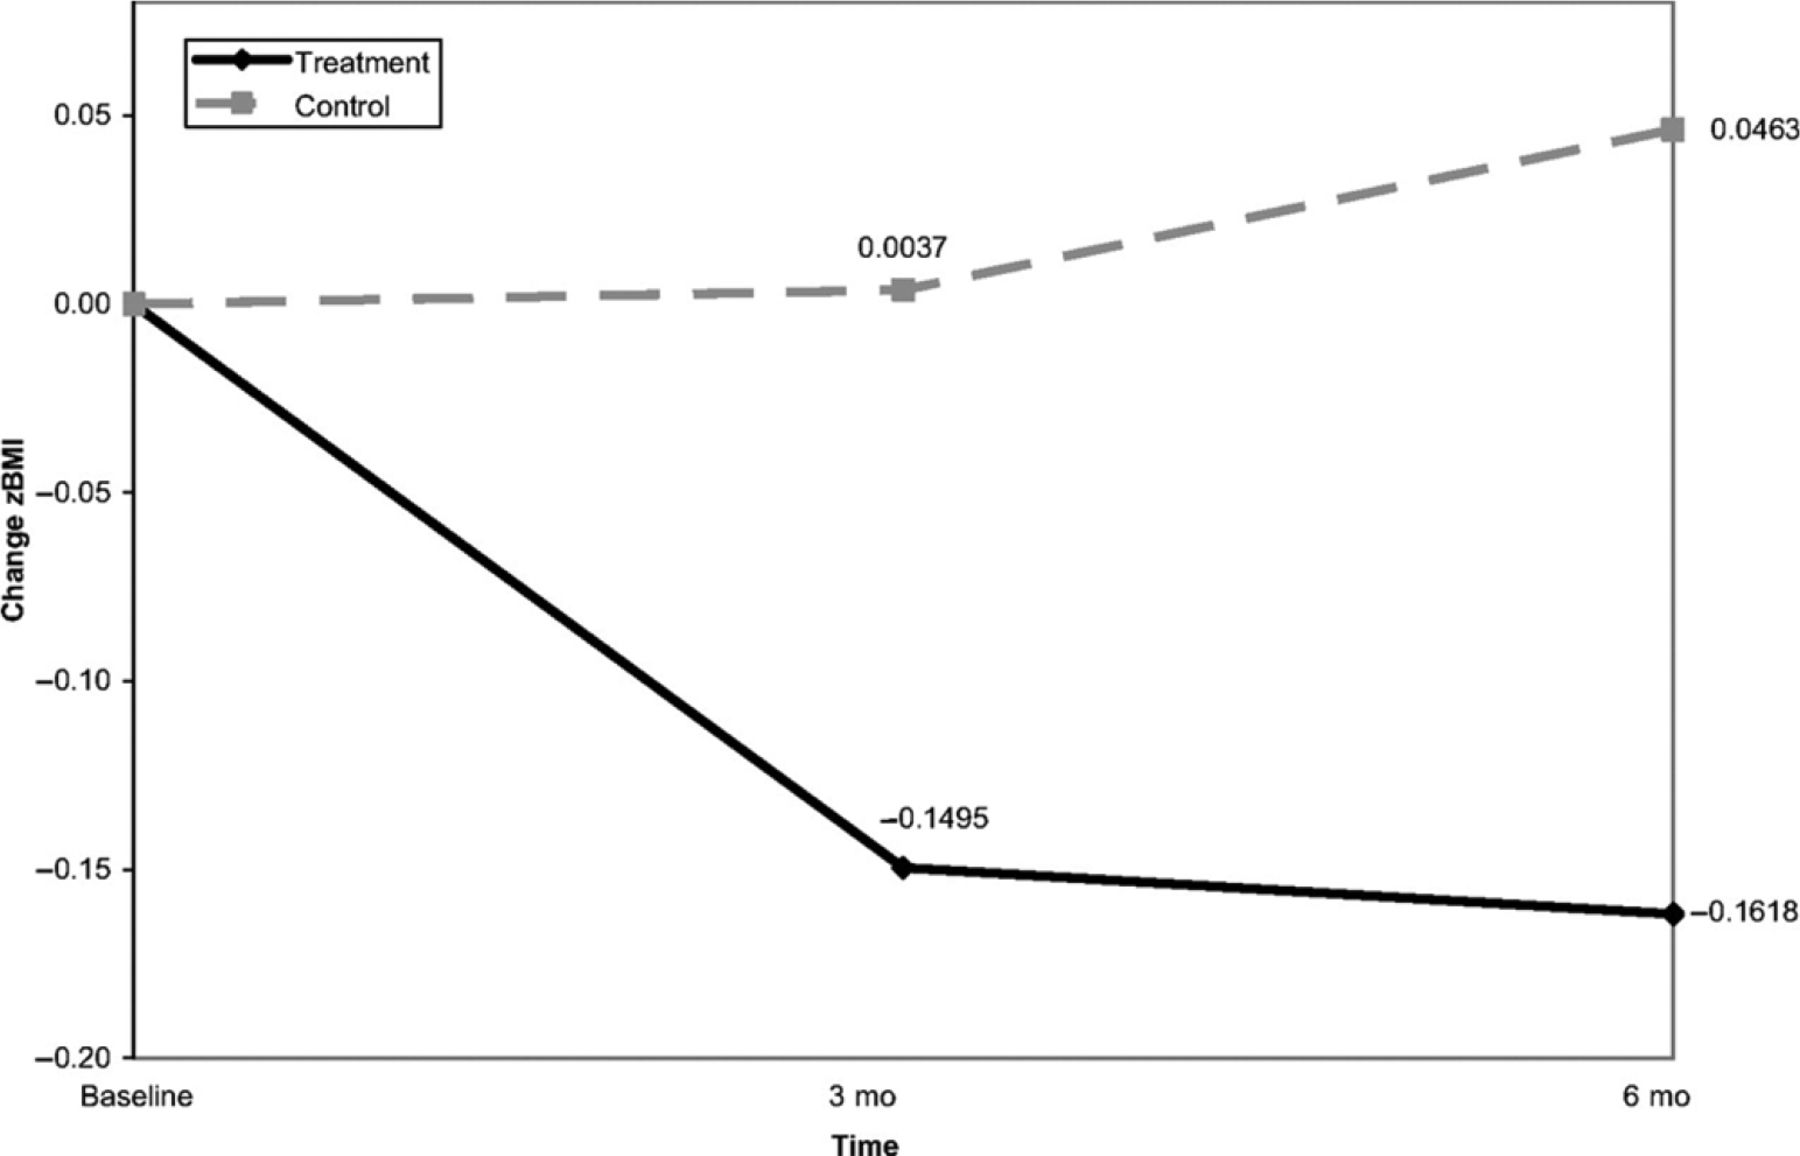
- Figure 1.
Percent Change in Standardized BMI at Baseline, 3, and 6 Months
zBMI=standardized body mass index.
Johnston CA et al. Weight Loss in Overweight Mexican American Children: A Randomized, Controlled Trial. Pediatrics. 2007;120:1450–1457. Reproduced with permission from Pediatrics, 120, 1450–1457, Copyright © 2007 by the AAP.
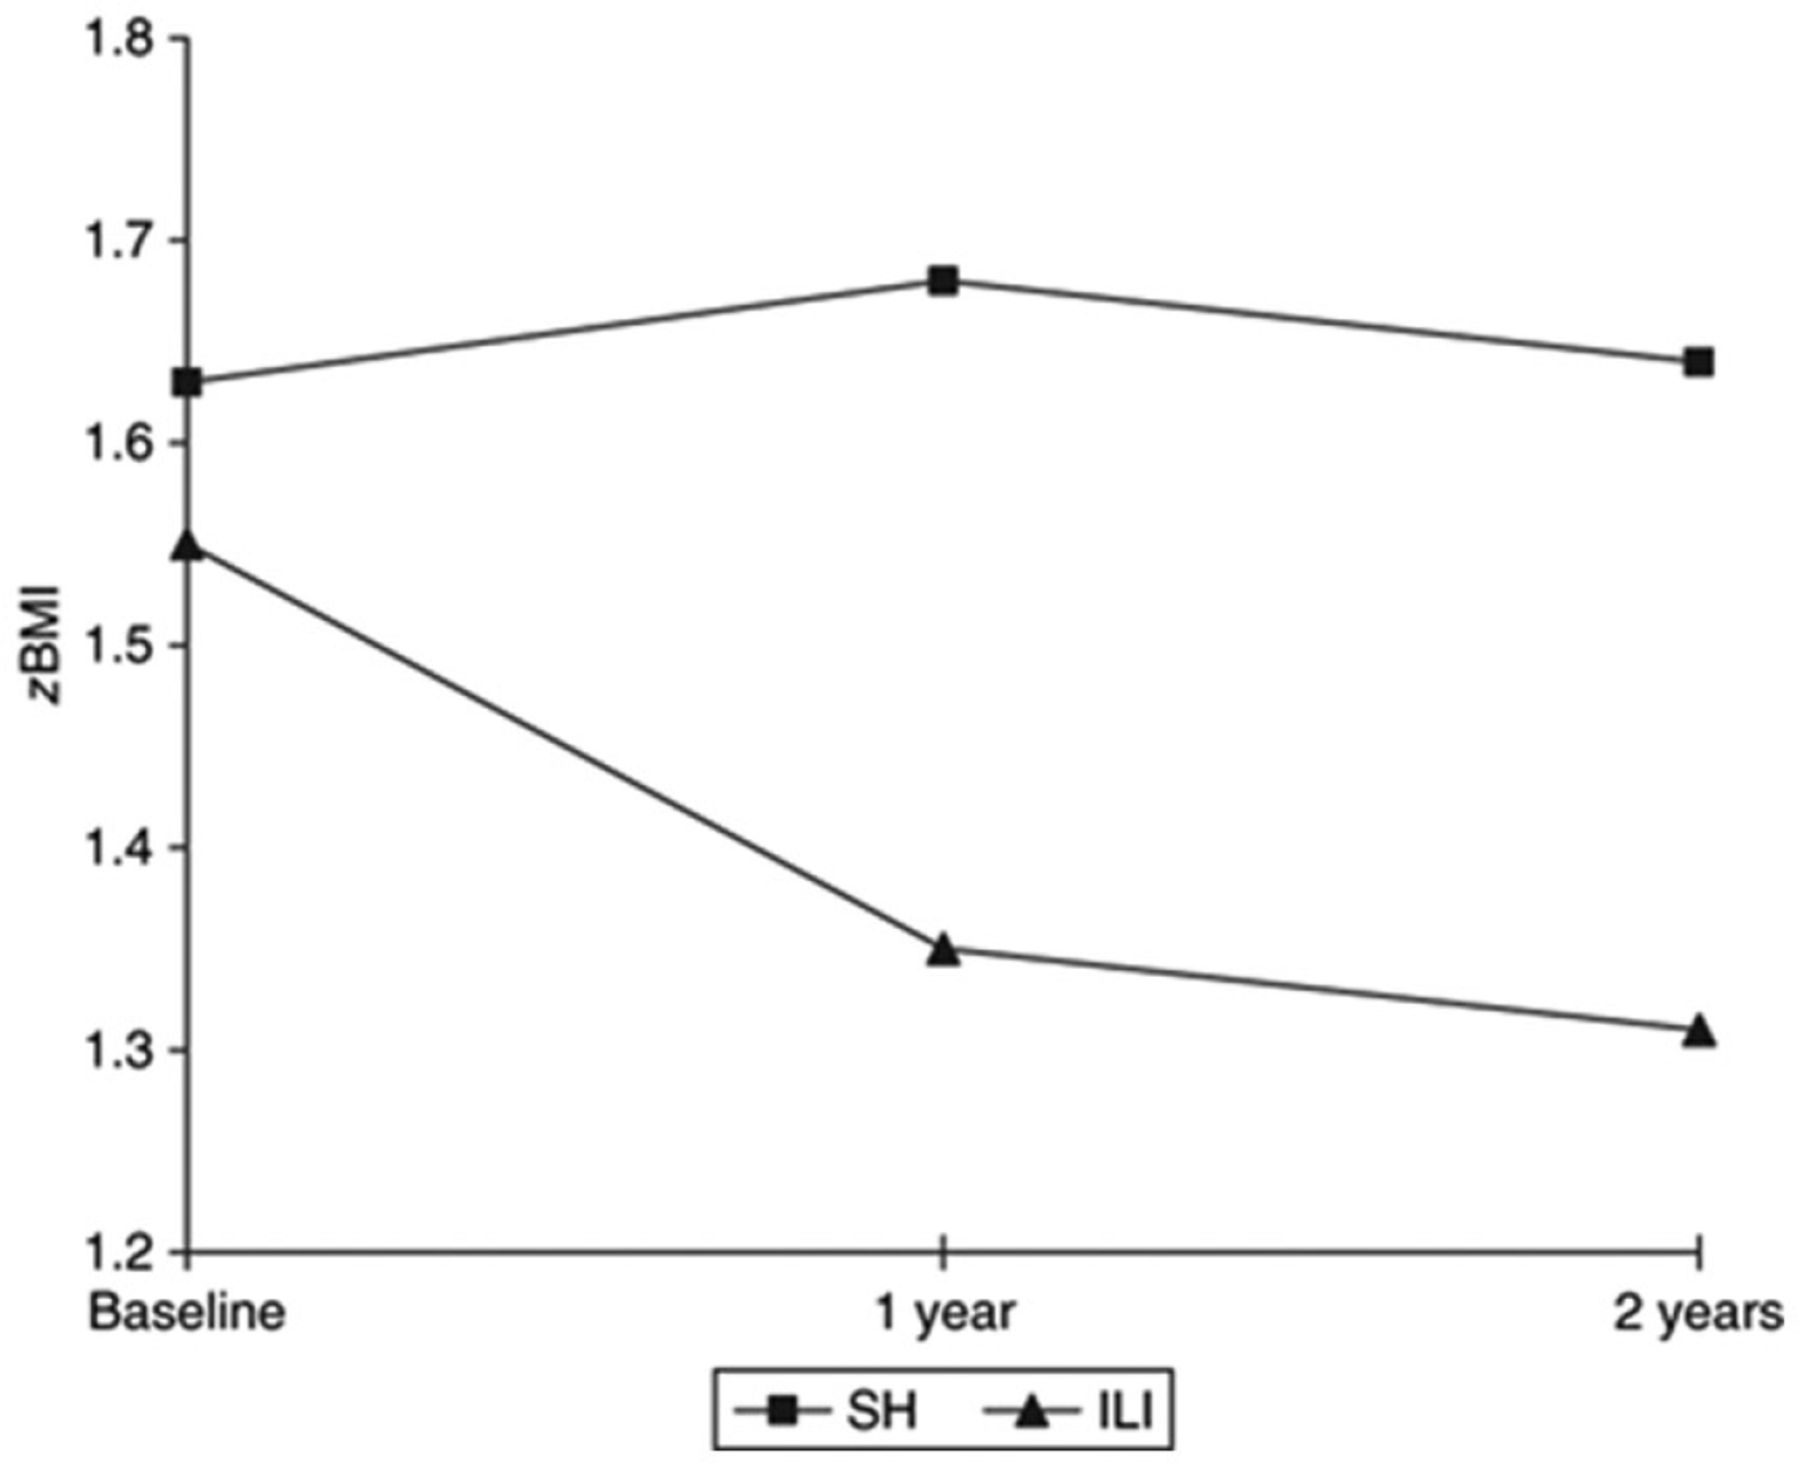
- Figure 2.
Sustained Benefits in BMI at 2 Years
BMI=body mass index; ILI=instructor-led intervention; SH=self-help.
Johnston CA et al. Effects of a School-based Weight Maintenance Program for Mexican-American Children: Results at 2 Years. Obesity. 2010;18:542–547. Reproduced with permission from John Wiley & Sons, Inc.
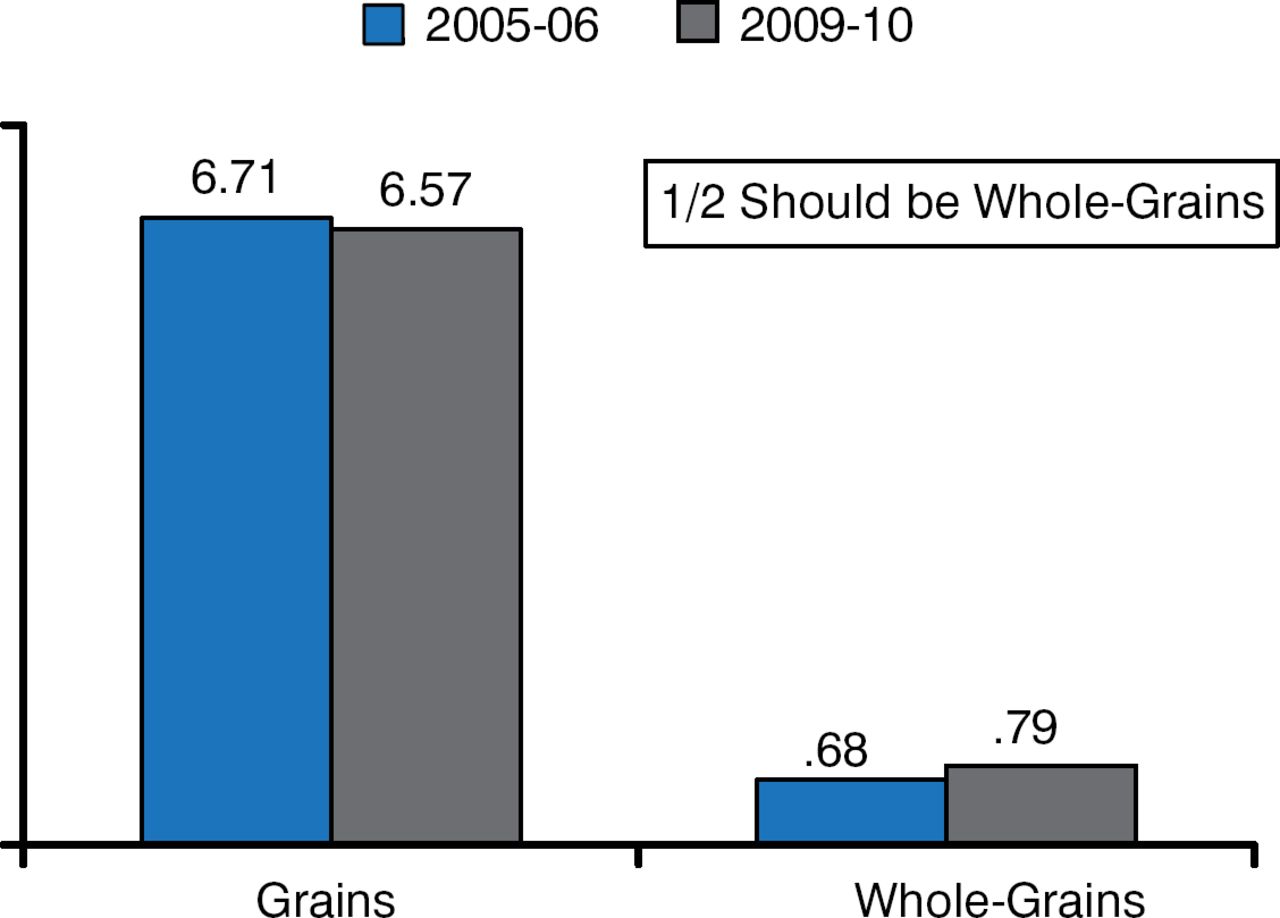
- Figure 3.
Mean Intake of Grains and Whole Grains (Ounce Equivalents)
Source: USDA. Agricultural Research Service. What We Eat in America, NHANES 2005–2006 and 2009–2010.
Reproduced with permission from CA. Johnston, PhD.
- Figure 4.
Peanuts and Peanut Butter Reduce T1DM in Women
T1DM=Type 1 Diabetes Mellitus Source: Jiang R et al. JAMA 2002.
Reproduced with permission from CA. Johnston, PhD.


Tools
Controlled Snacking and Peanut Consumption Reduces Caloric Intake in Adolescents
Permalink:


Table of contents
Cited By...
- No citing articles found.