

Article Figures & Data
Figures
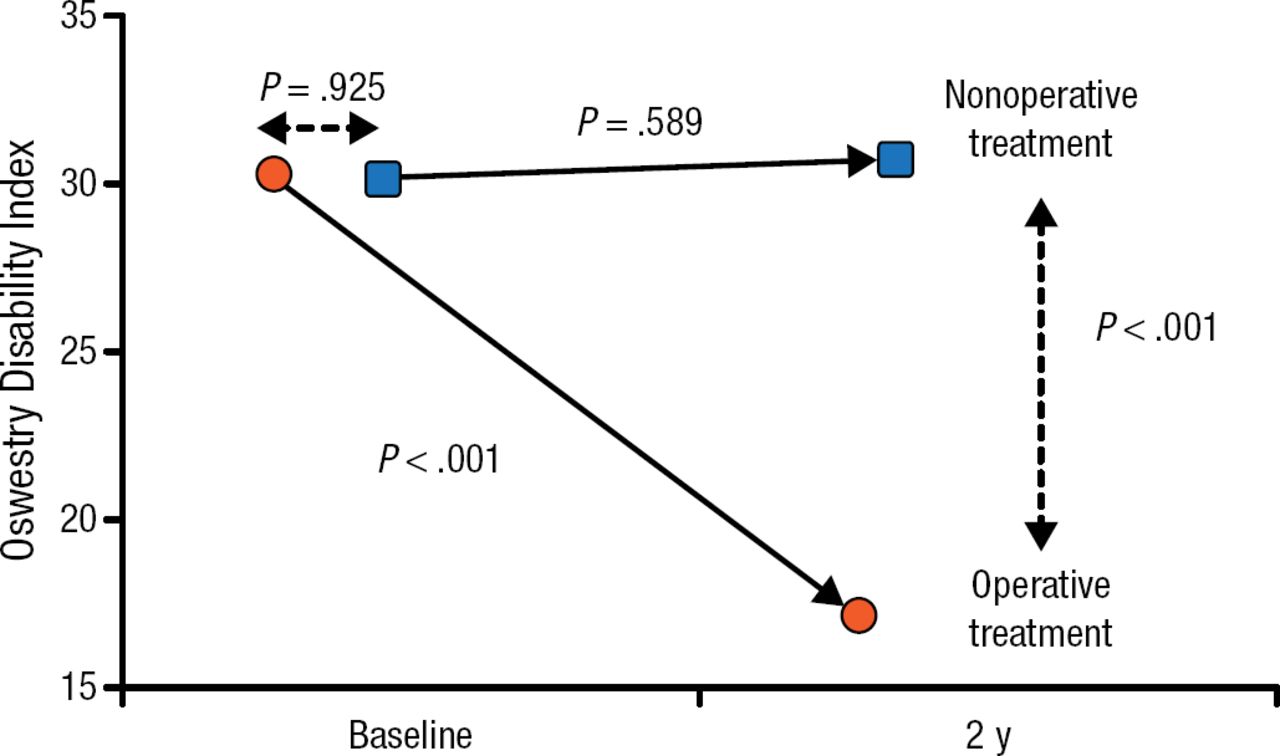
- Figure 1.
Operative vs Nonoperative Treatment: Impact on Disability
Data are presented for 97 propensity-matched operative-nonoperative pairs. P values were calculated with the paired t test.
Reproduced with permission from JS Smith, MD, PhD.

Tables
Tools
Significant Improvement in ASD with Operative vs Nonoperative Treatment
Permalink:


Table of contents
Cited By...
- No citing articles found.