

Article Figures & Data
Figures
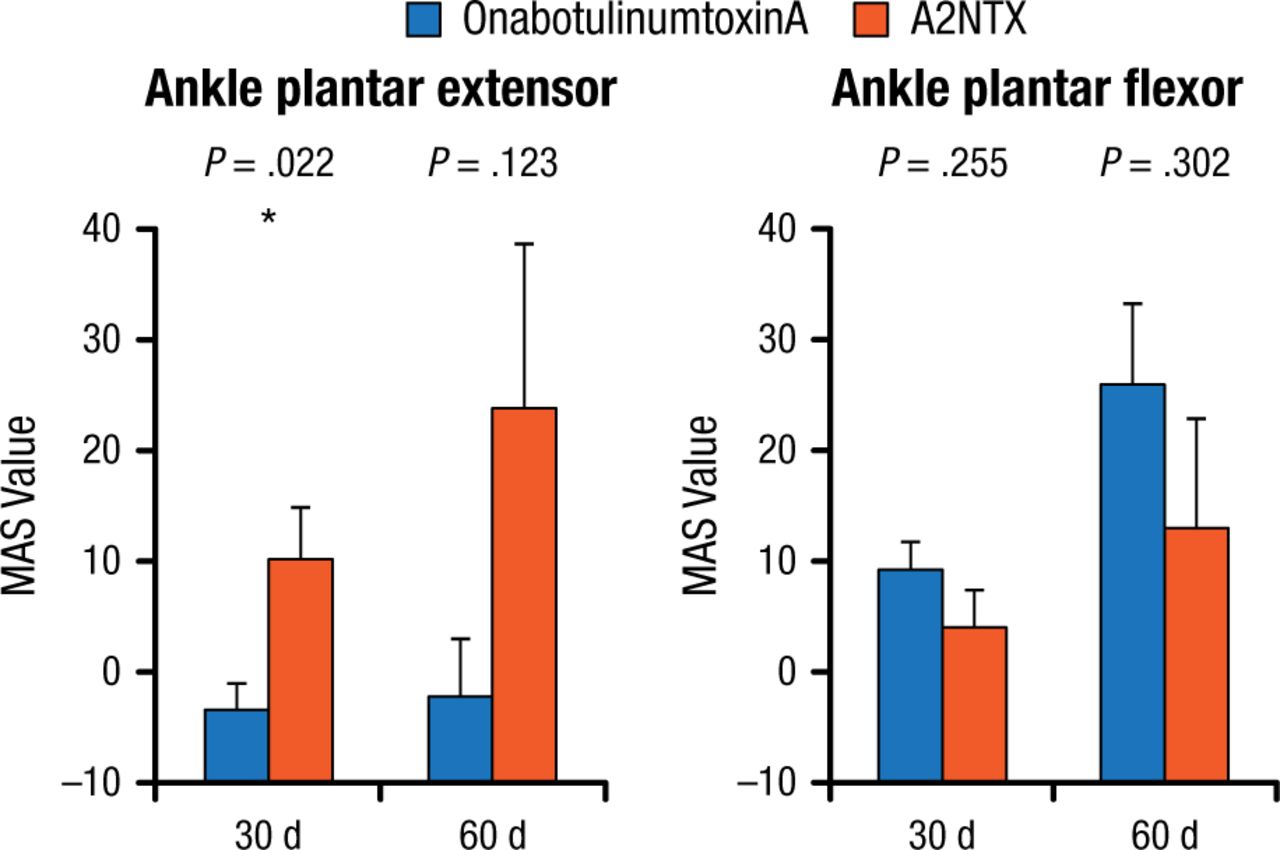
- Figure 1.
Changes in Extensor and Flexor MAS Values at 30 and 60 Days
Mean ± standard error of AUC, Student t.
AUC, area under the curve; MAS, Modified Ashworth Scale.
*Paired-t analysis.
Reproduced with permission from R Kaji, MD.

Tools
A2NTX an Effective Substitute for OnabotulinumtoxinA in Poststroke Spasticity
Permalink:


Table of contents
Cited By...
- No citing articles found.