

Article Figures & Data
Figures
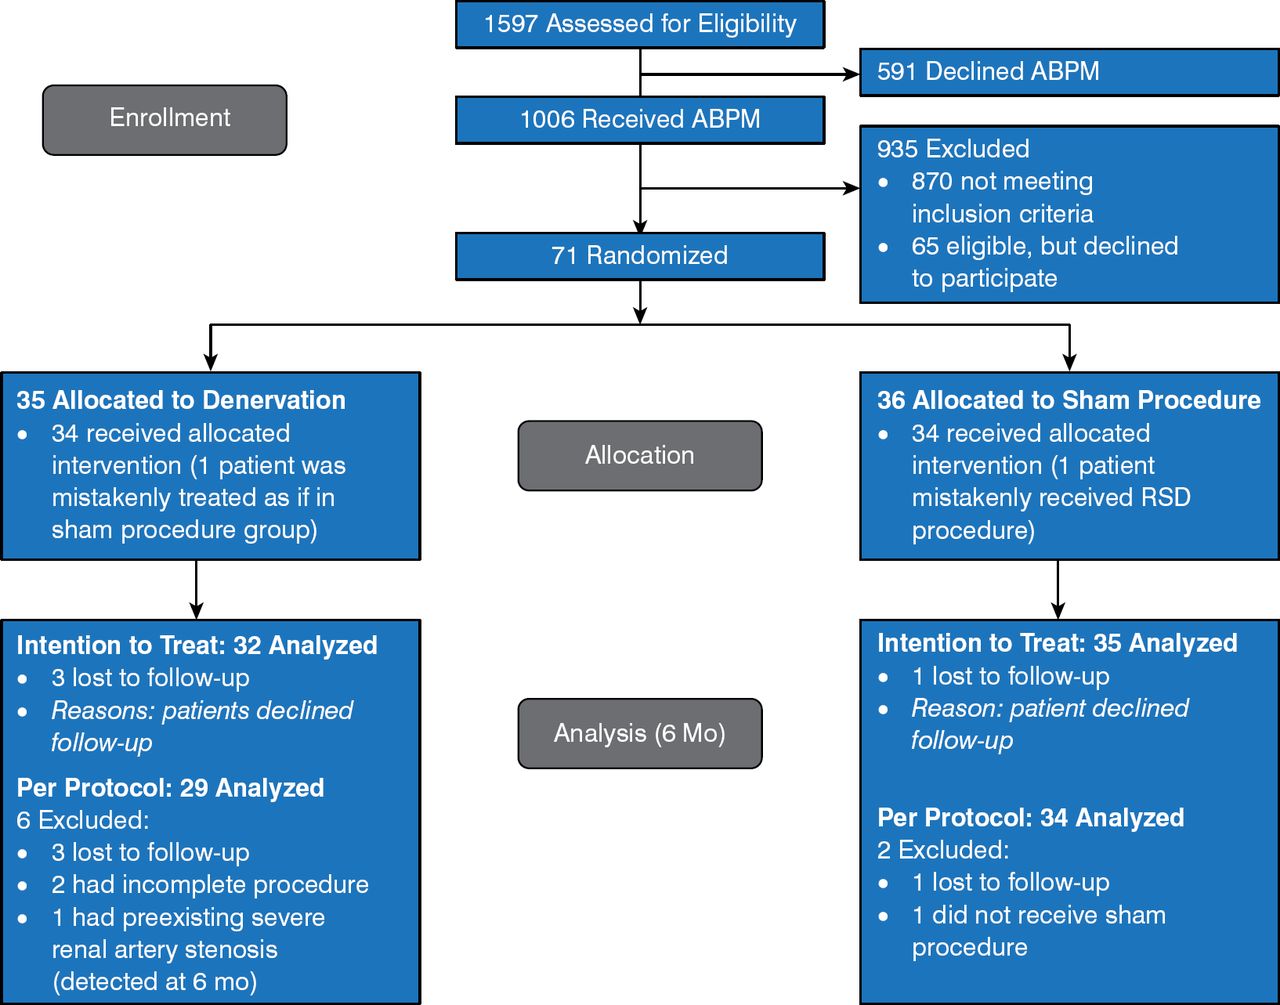
- Figure 1.
Flow Chart of the Study
ABPM, ambulatory blood pressure measurement; RSD, renal sympathetic denervation.
Reproduced with permission from S Desch, MD.
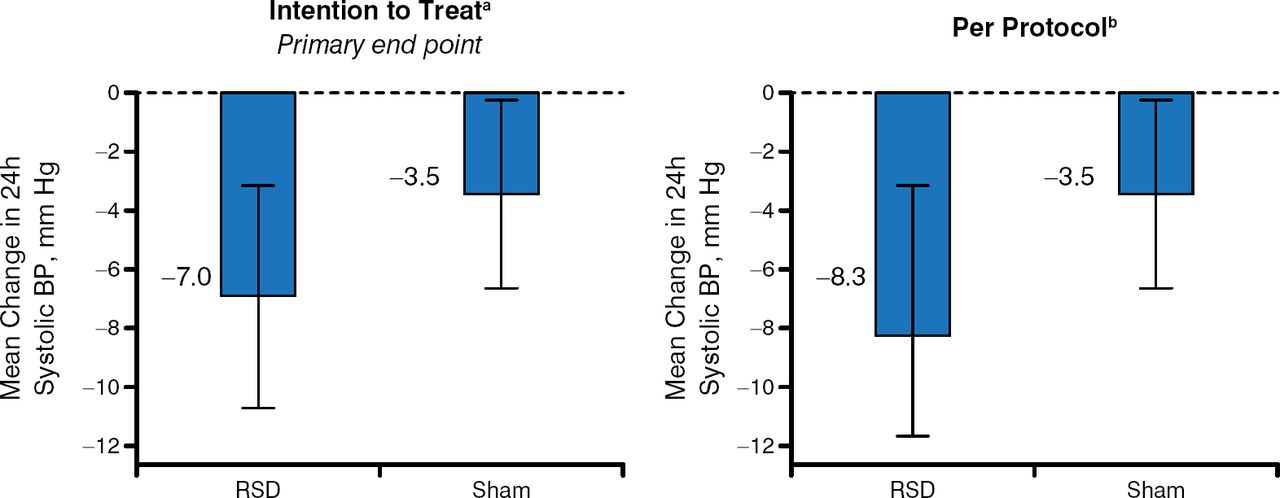
- Figure 2.
Primary End Point Results
BP, blood pressure; RSD, renal sympathetic denervation.
a P = .15 for between-group comparison; b P = .042 for between-group comparison; Error bars show 95% CI.
Reproduced with permission from S Desch, MD.


Tools


Table of contents
Cited By...
- No citing articles found.