

Article Figures & Data
Figures
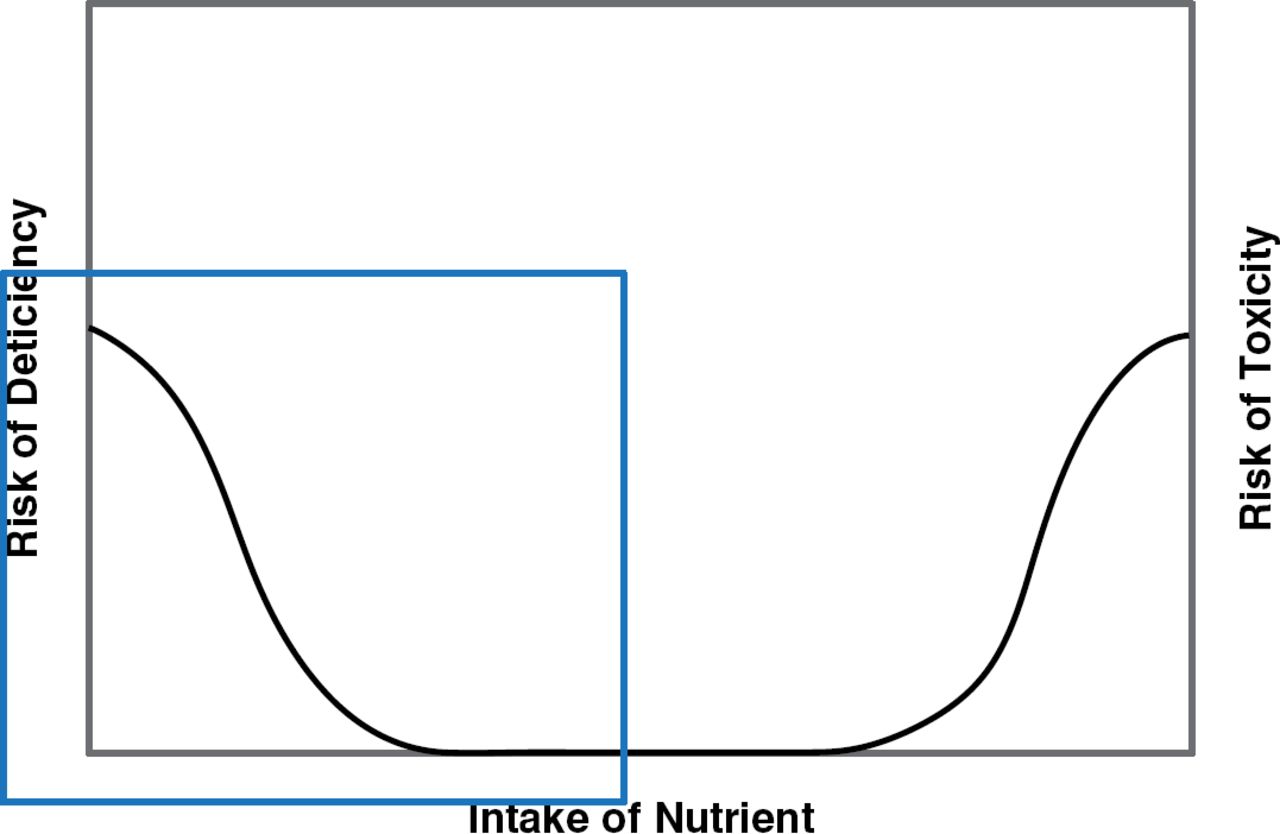
- Figure 1.
Nutrient Response and Intake Curve
Adapted from IOM. Dietary Reference Intakes for Water, Potassium, Sodium, Chloride, and Sulfate. Washington, DC: The National Academies Press, 2005.
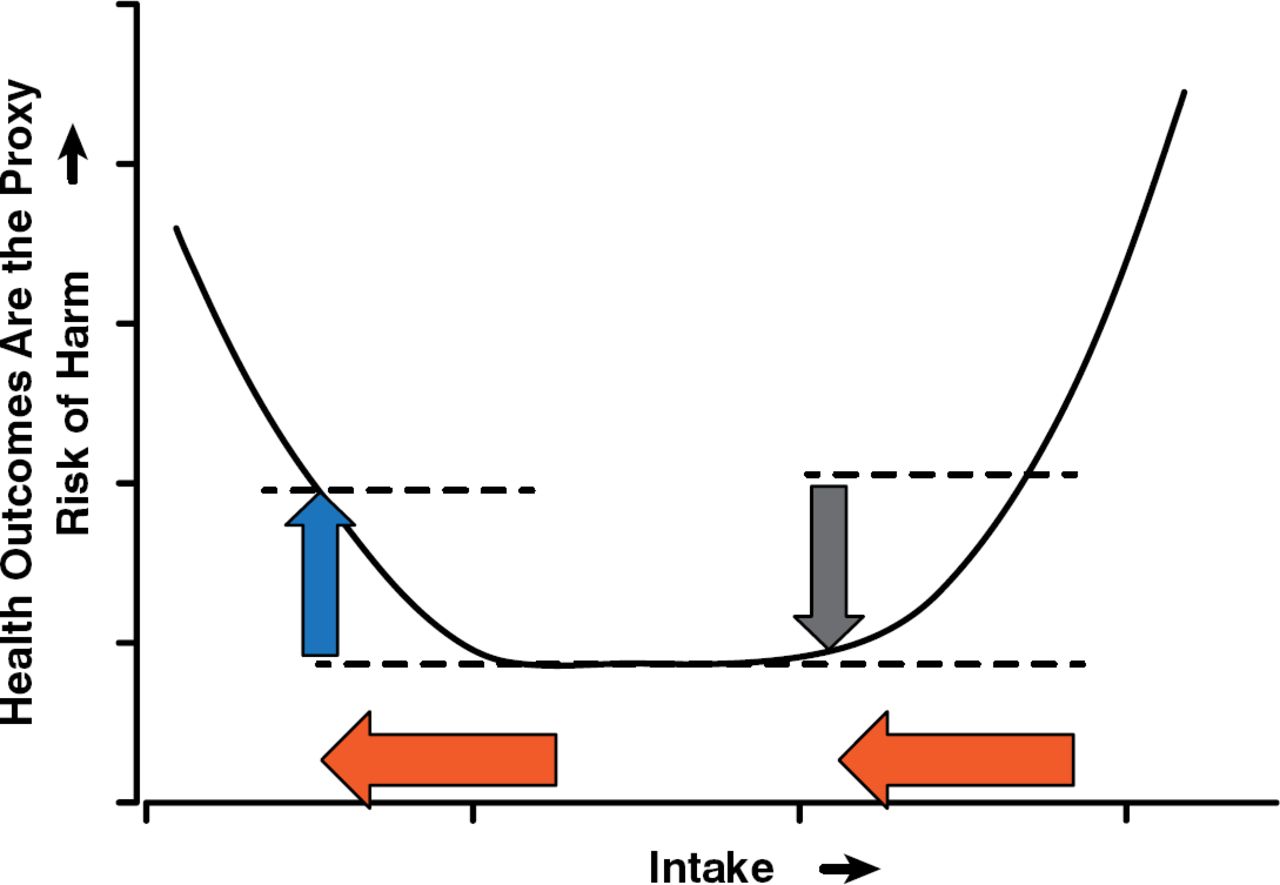
- Figure 2.
The Importance of Starting Intake Levels
Reproduced with permission from RP Heaney, MD.
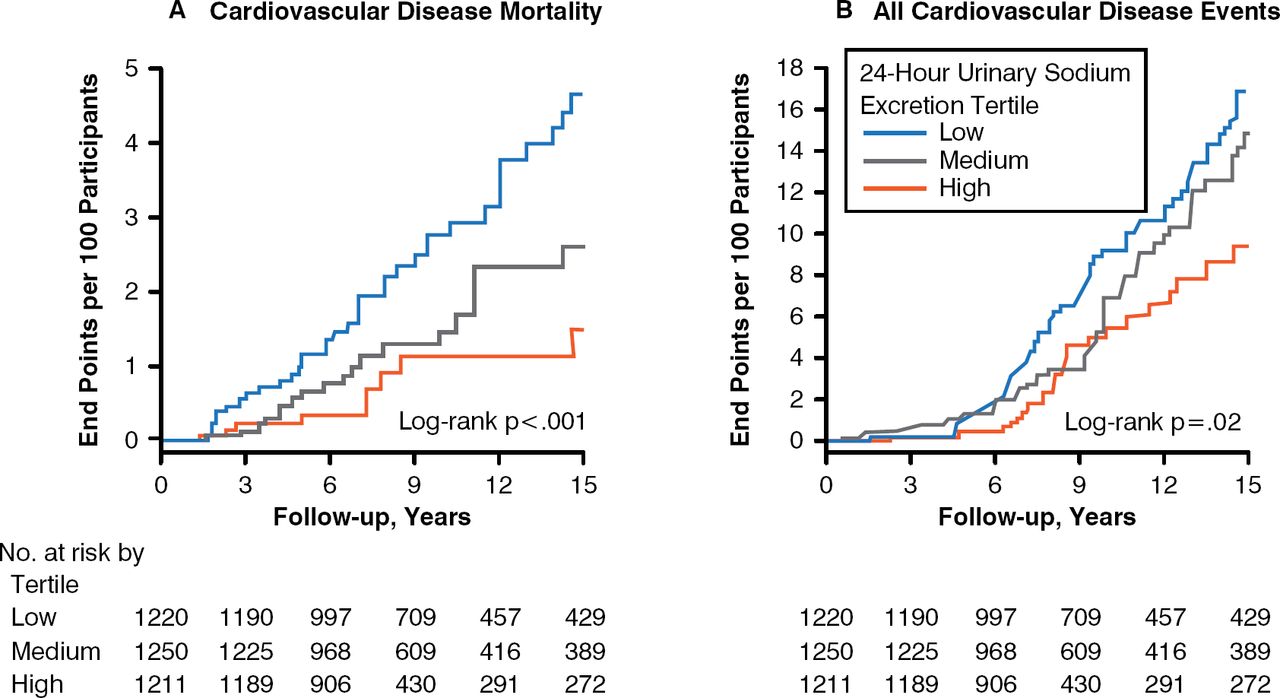
- Figure 3.
Cardiovascular Mortality and Morbidity and Sodium Intake
Reproduced from Stolarz-Skzypek K et al. Fatal and Nonfatal Outcomes, Incidence of Hypertension, and Blood Pressure Changes in Relation to Urinary Sodium Excretion. JAMA 2011;305(17):1777–1785. Copyright 2011 American Medical Association. All rights reserved.
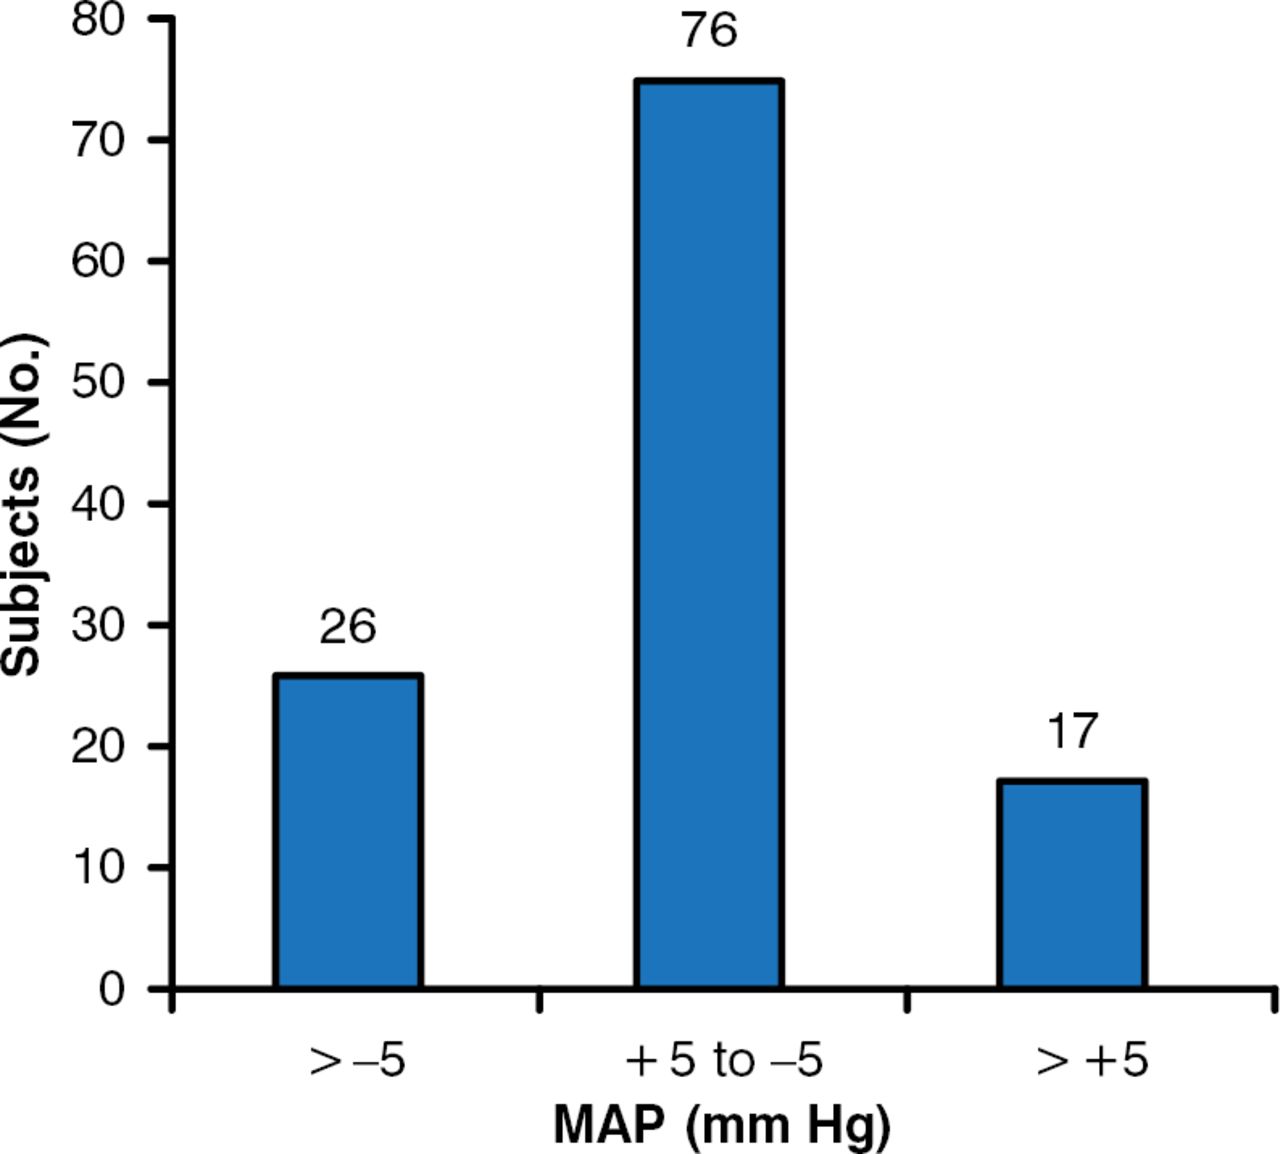
- Figure 4.
Heterogeneity of Blood Pressure Response in 119 Mild Hypertensive Subjects
MAP=mean arterial pressure.
Sources: Longworth DL et al. Clin Pharmacol Titer 1980; MacGregor GA et al. Lancet 1982; Watt G et al. Br Med/1983.
Reproduced with permission from M Alderman, MD.
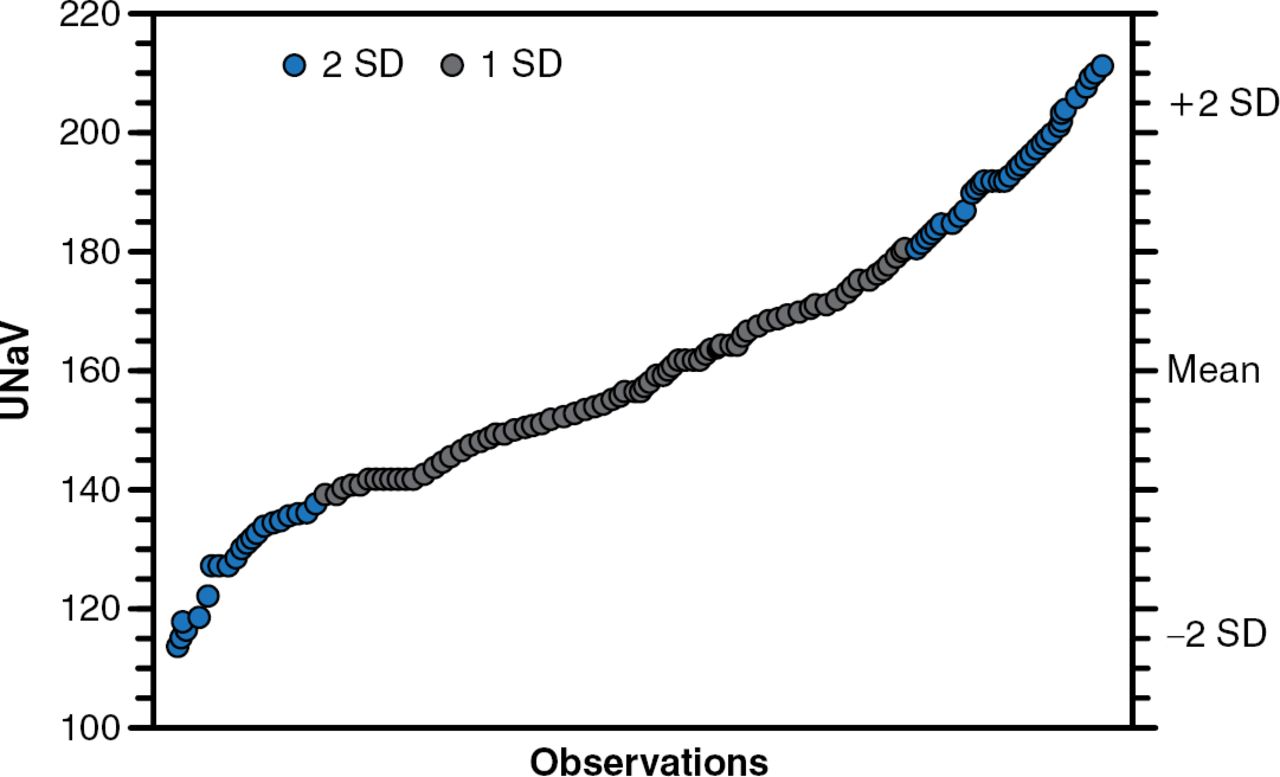
- Figure 5.
Range of Human Sodium Intake Worldwide
SD=standard deviation; UNaV=urinary sodium excretion.
Based on 24-hour UNaV in 69,011 subjects worldwide; 5 decades, 45 countries; mean: 159.4 ± 22.3 mmols/day; range: 114–210 mmols/day (2622–4830 mg/day).
Reproduced from McCarron DA et al. Normal Range of Human Dietary Sodium Intake: A Perspective Based on 24-Hour Urinary Sodium Excretion Worldwide. Am J Hypertens 2013;26(10):1218–1223. With permission from Oxford University Press.


Tools


Table of contents
Cited By...
- No citing articles found.