

Article Figures & Data
Figures
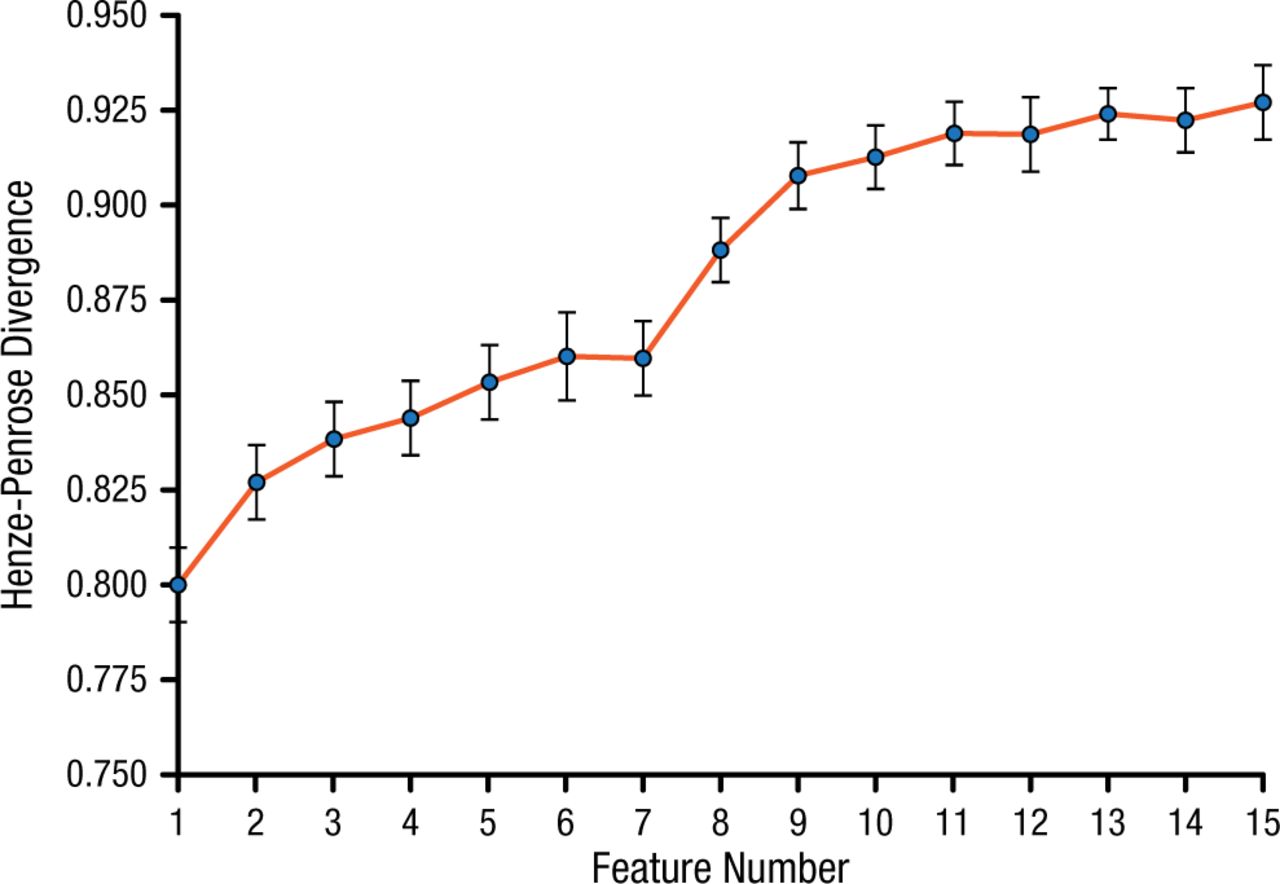
- Figure 1.
Henze-Penrose Divergence Between Patients With Migraine and Healthy Controls
Values range from 0.5 (subject groups cannot be separated) to 1 (subject groups are completely separable).
Adapted from Schwedt TJ et al. Temporal lobe cortical thickness correlations differentiate the migraine brain from the healthy brain. PLoS One. 2015;10:e0116687. doi:10.1371/journal.pone.0116687
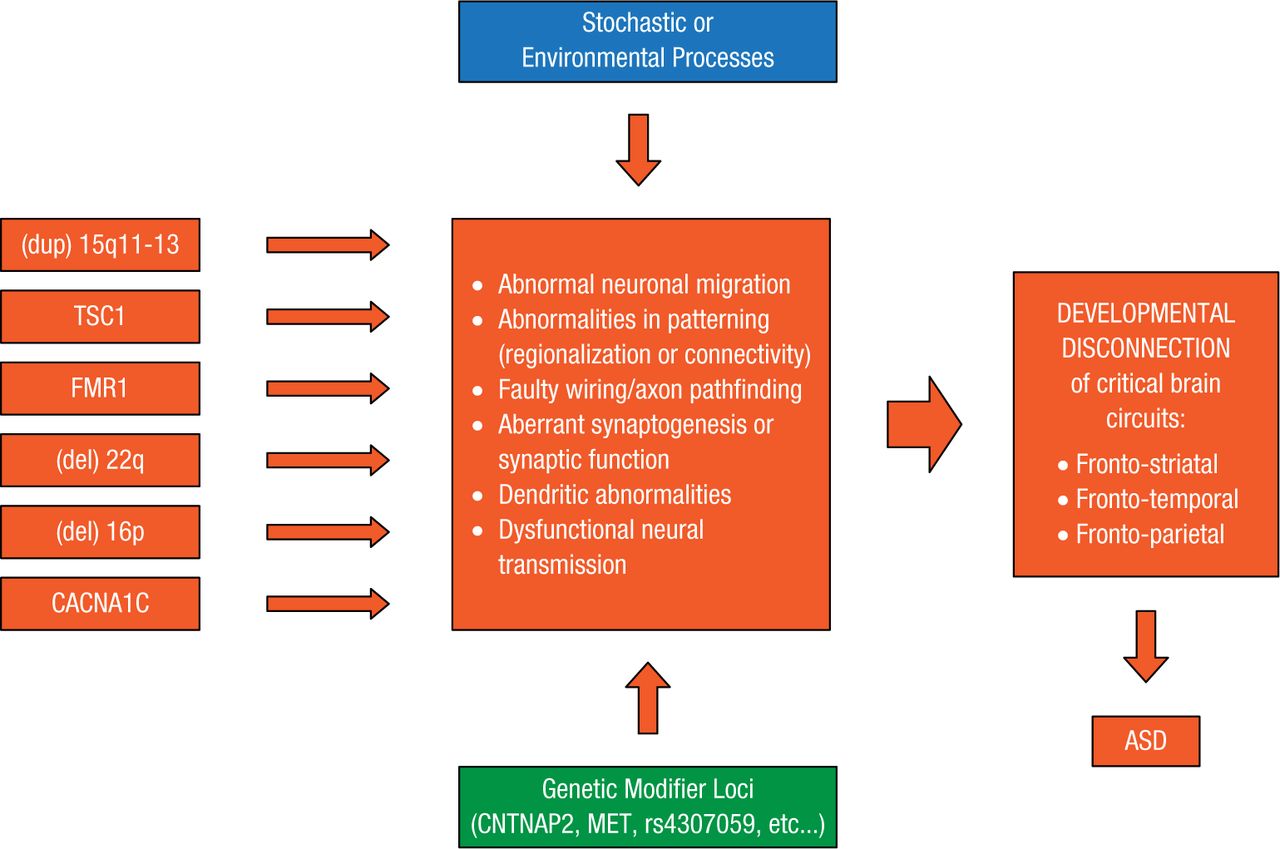
- Figure 2.
Levels of Convergence in ASD
ASD, autism spectrum disorder.
Reprinted from Geschwind DH. Genetics of autism spectrum disorders. Trends Cogn Sci. 2011;15:409-416. With permission from Elsevier Ltd.


Tools


Table of contents
Cited By...
- No citing articles found.