

Article Figures & Data
Figures
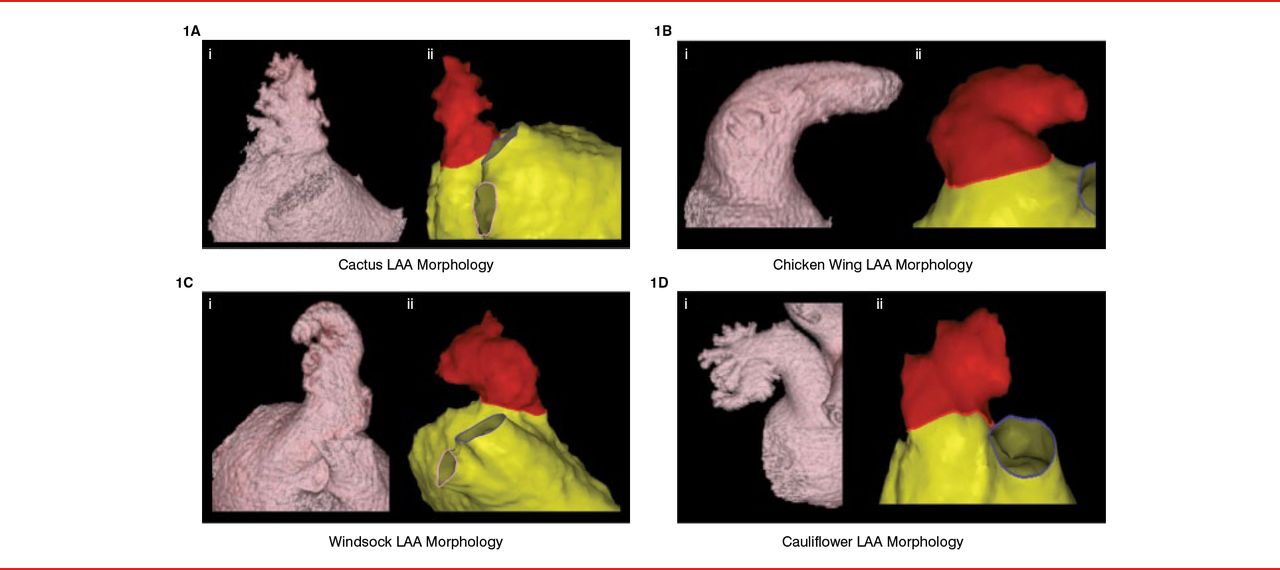
- Figure 1.
CT and MRI Scans of Various LAA Morphologies
CT=computed tomography; LAA=left atrial appendage; MRI=magnetic resonance imaging.
Reproduced from Di Biase L et al. Does the left atrial appendage morphology correlate with the risk of stroke in patients with atrial fibrillation? Results from a multicenter study. J Am Coll Cardiol 2012;60:531–538. With permission from Elsevier.
- Figure 2.
Prior Stroke or TIA Event Rate by Morphology
TIA=transient ischemic attack.
Reproduced from Di Biase L et al. Does the left atrial appendage morphology correlate with the risk of stroke in patients with atrial fibrillation? Results from a multicenter study. J Am Coll Cardiol 2012;60:531–538. With permission from Elsevier.
- Figure 3.
Impact of Non-Chicken Wing Mortality in Patients With CHADS2 Score 0 or 1
Reproduced from Di Biase L et al. Does the left atrial appendage morphology correlate with the risk of stroke in patients with atrial fibrillation? Results from a multicenter study. J Am Coll Cardiol 2012;60:531–538. With permission from Elsevier.
- Figure 4.
Effects of LAA Ligation on LAA Electrical Activity
LAA=left atrial appendage.
Reproduced from Han FT et al. The effects of LAA ligation on LAA electrical activity. Heart Rhythm 2014;11:864–870. With permission from Elsevier.
- Figure 5.
Safety: PROTECT-AF Versus CAP/PREVAIL
Note: Overembolization rate across studies is 0.5%.
Reproduced with permission from VY Reddy, MD.


Tools


Table of contents
Cited By...
- No citing articles found.