

Article Figures & Data
Figures
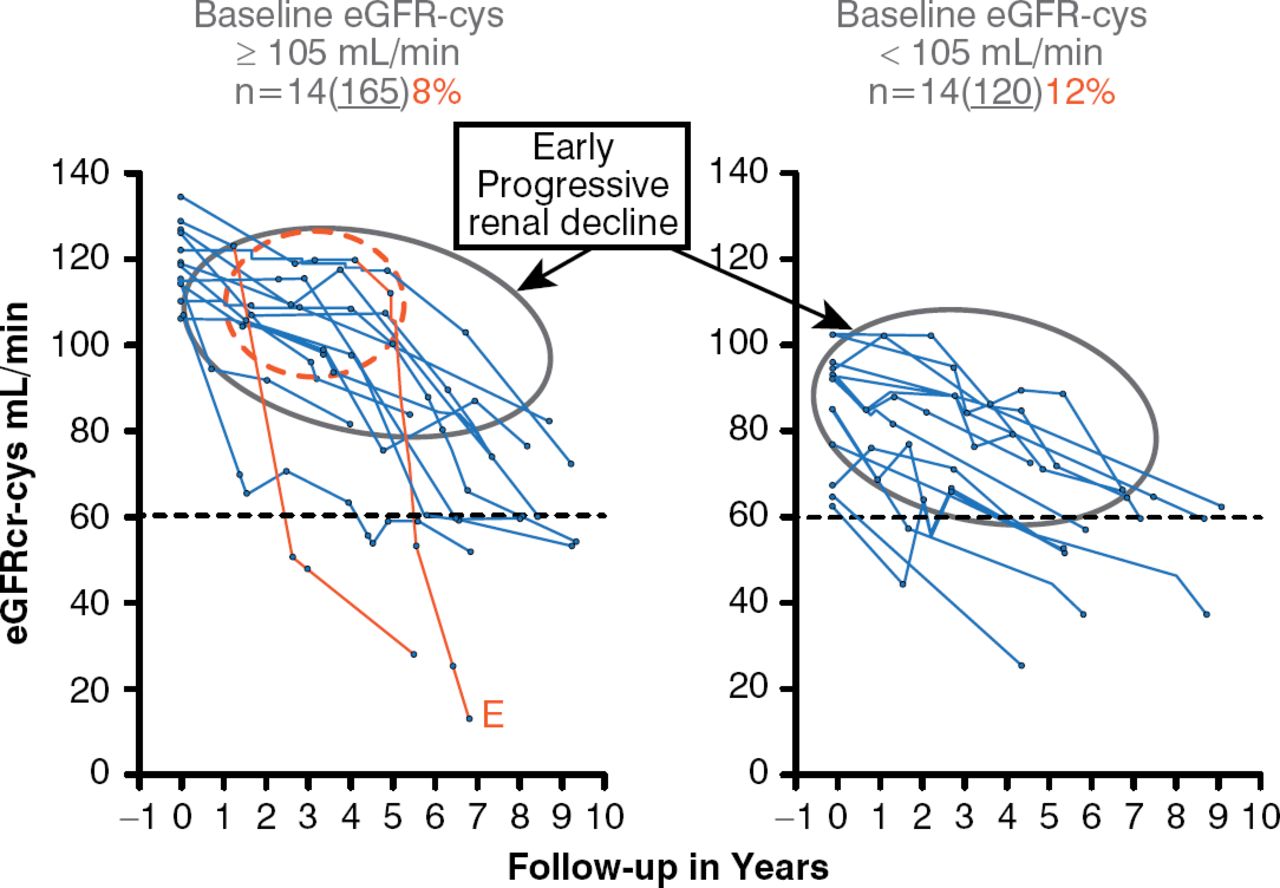
- Figure 1.
Early Progressive Renal Decline in Patients With Type 1 Diabetes
eGFRcr-cys = estimated glomerular filtration rate by creatinine and cystatin C.
Reproduced from Krolewski AS et al. Early Progressive Renal Decline Precedes the Onset of Microalbuminuria and Its Progression to Macroalbuminuria. Diabetes Care 2014;7:226–234. Copyright © 2014 American Diabetes Association. All rights reserved.
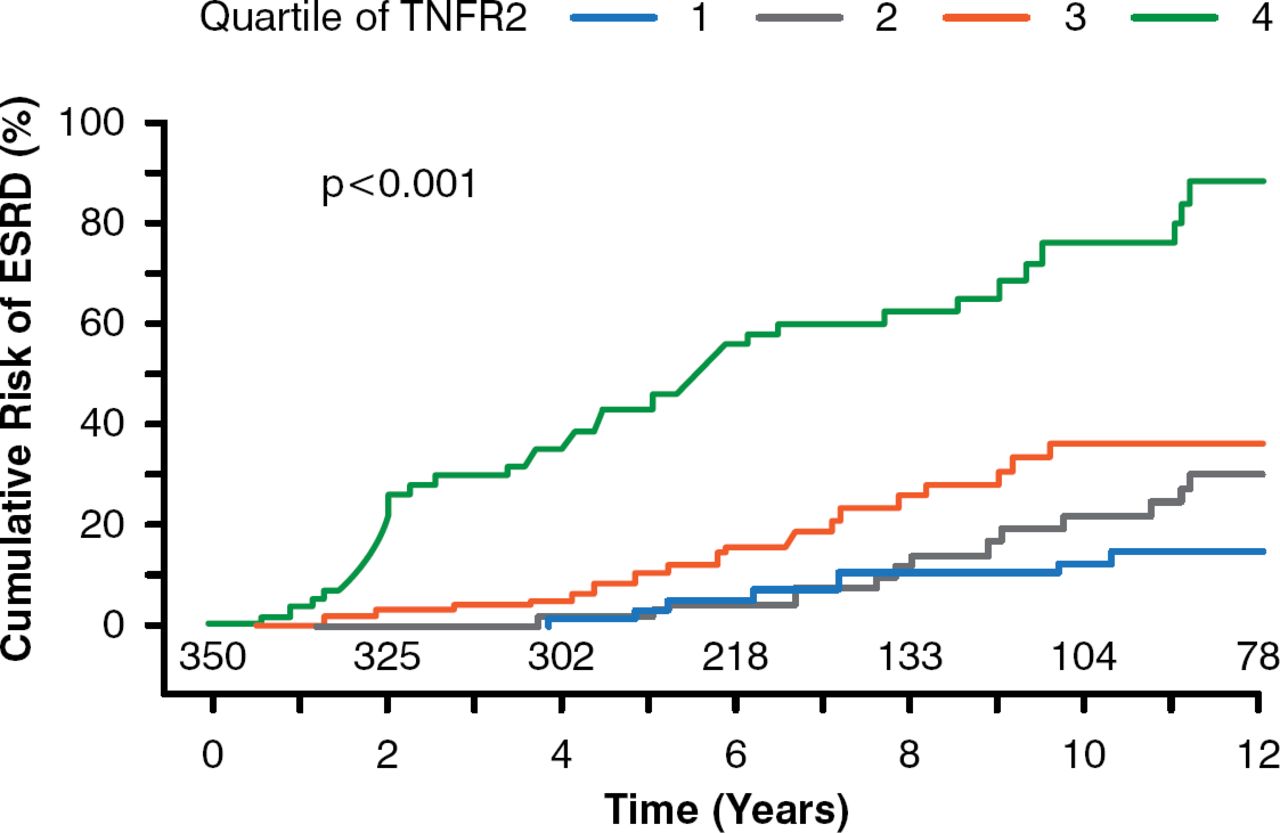
- Figure 2.
Tumor Necrosis Factor Receptor 2 as a Predictive Marker of End-Stage Renal Disease
ESRD = end-stage renal disease; TNFR2 = tumor necrosis factor receptor 2.
Reproduced from Skupien J et al. Synergism Between Circulating Tumor Necrosis Factor Receptor 2 and HbA1c in Determining Renal Decline During 5–18 Years of Follow-up in Patients With Type 1 Diabetes and Proteinuria. Diabetes Care 2014; doi:10.2337/dc13-1983. Copyright © 2014 American Diabetes Association. All rights reserved.
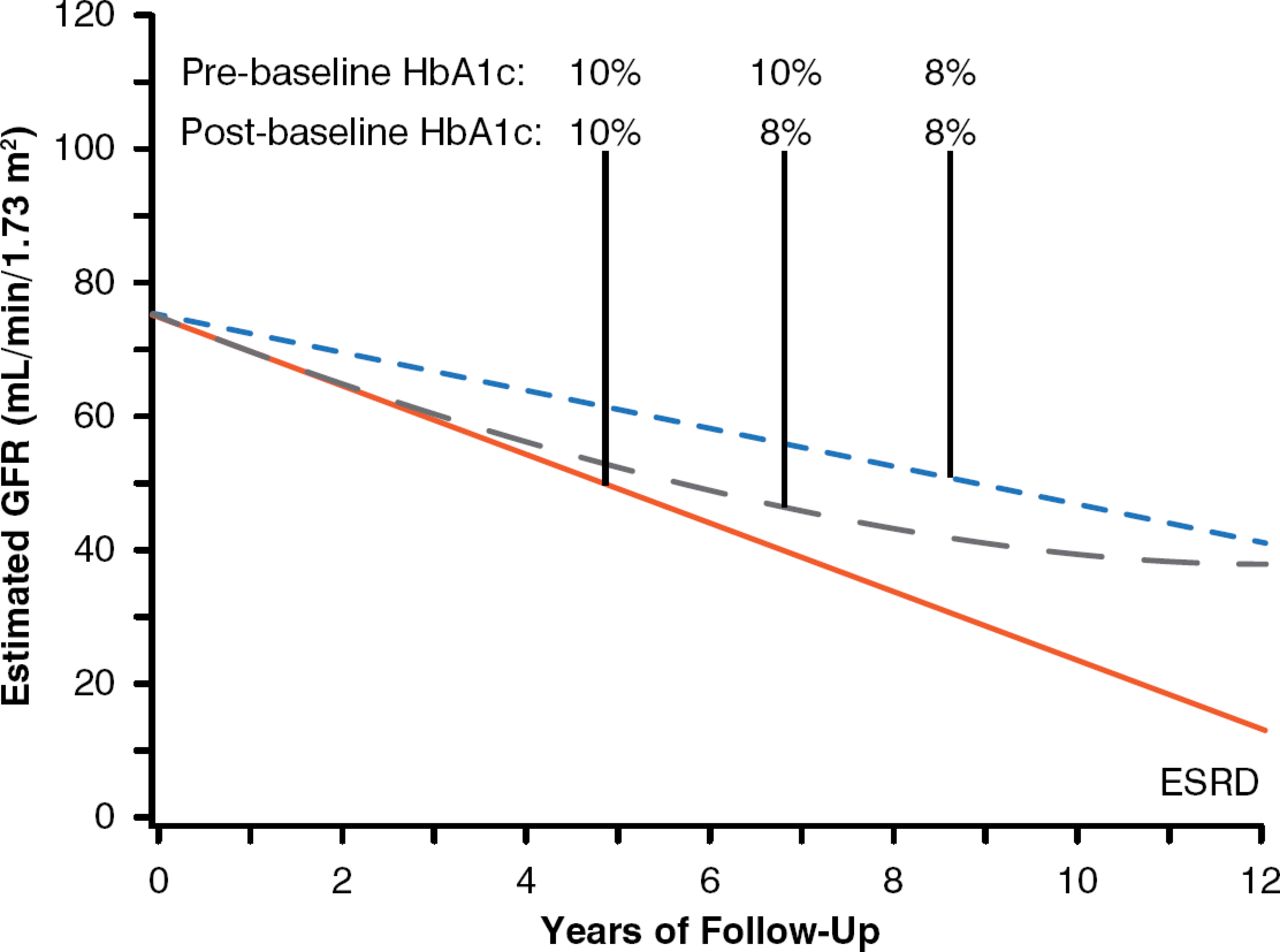
- Figure 3.
Effect of Glycemic Control on Risk of Developing End-Stage Renal Disease
ESRD = end-stage renal disease; GFR = glomerular filtration rate.
Reproduced from Skupien J et al. Improved Glycemic Control and Risk of ESRD in Patients With Type 1 Diabetes and Proteinuria. JASN 2014; doi:10.1681/ASN.2013091002. Reproduced with permission from the American Society of Nephrology.
The editors would like to thank the many members of the 2014 American Diabetes Association presenting faculty who generously gave their time to ensure the accuracy and quality of the articles in this publication.


Tools
A New Paradigm in Diabetic Nephropathy: Early Progressive Renal Decline
Permalink:


Table of contents
Cited By...
- No citing articles found.