

Article Figures & Data
Figures
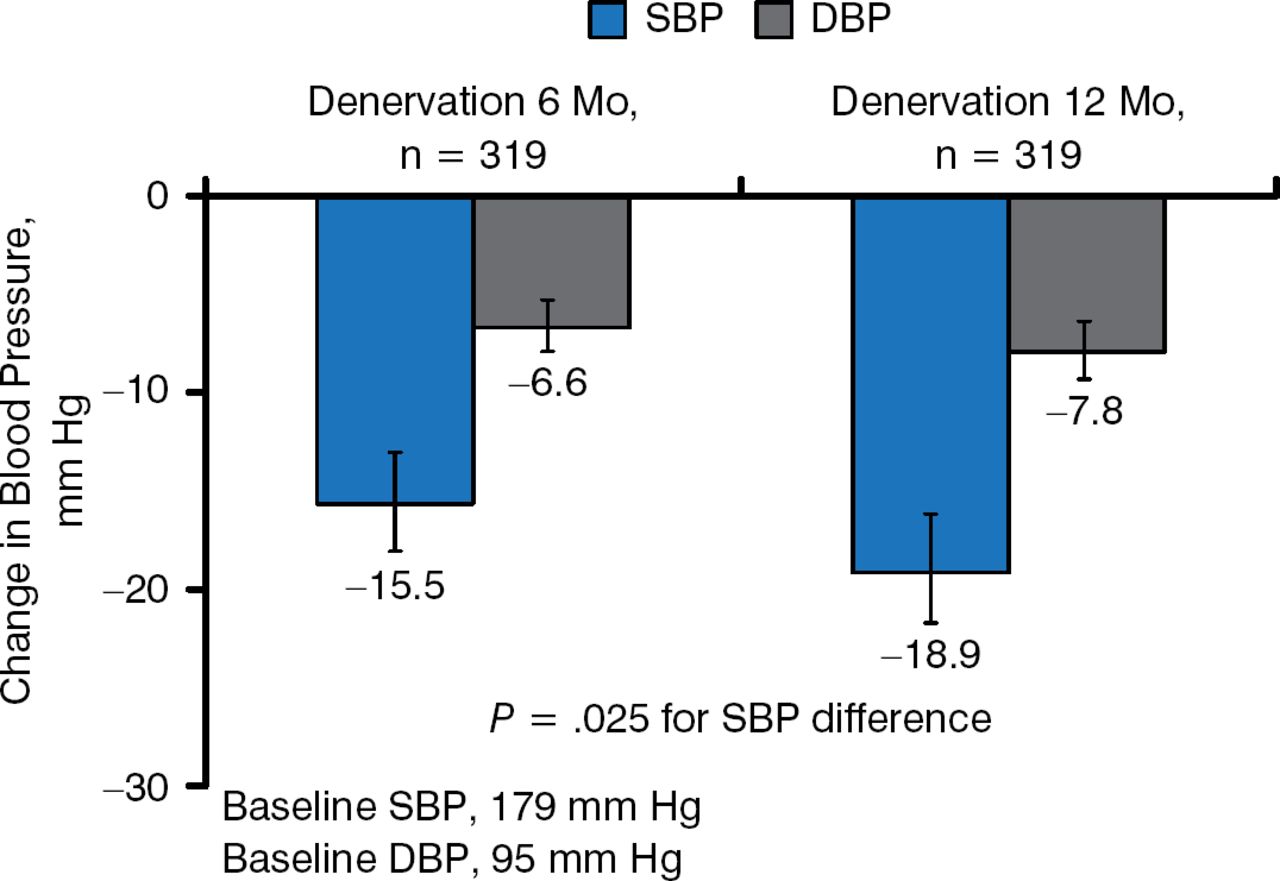
- Figure 1.
Change in Office BP at 6 and 12 Months for Matched Denervation Patients
BP, blood pressure; DBP, diastolic blood pressure; RDN, renal denervation; SBP, systolic blood pressure; SE, standard error.
BP changes are vs patient baseline, not RDN vs Control. Error bars = 1.96 SE.
Reproduced with permission from DL Bhatt, MD.
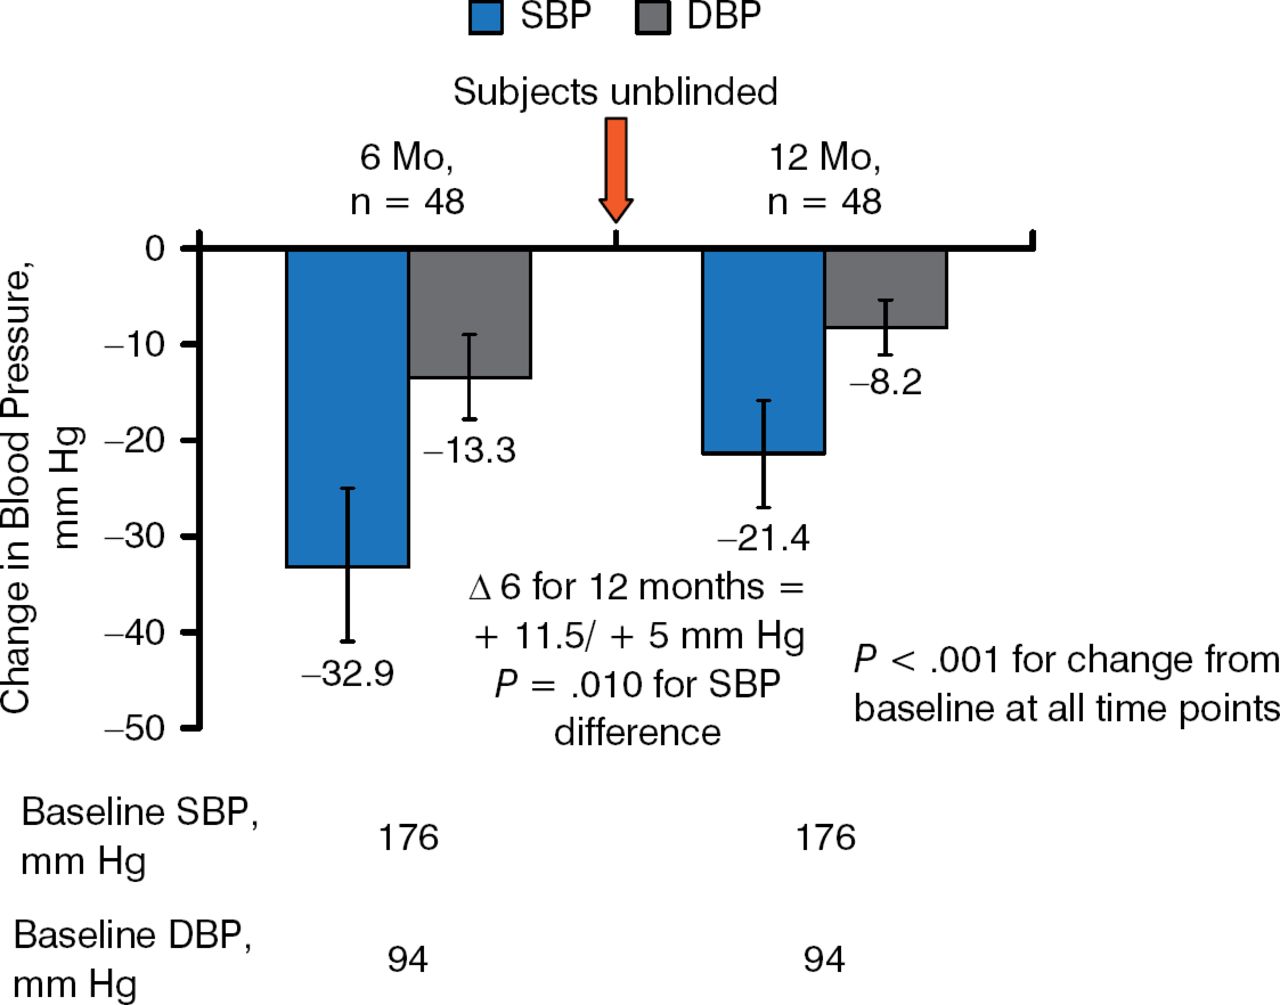
- Figure 2.
Change in Office BP at 6 and 12 Months for Noncrossover Sham Patients
BP, blood pressure; DBP, diastolic blood pressure; RDN, renal denervation; SBP, systolic blood pressure; SE, standard error.
BP changes are vs patient baseline, not RDN vs Control. Error bars = 1.96 SE.
Reproduced with permission from DL Bhatt, MD.
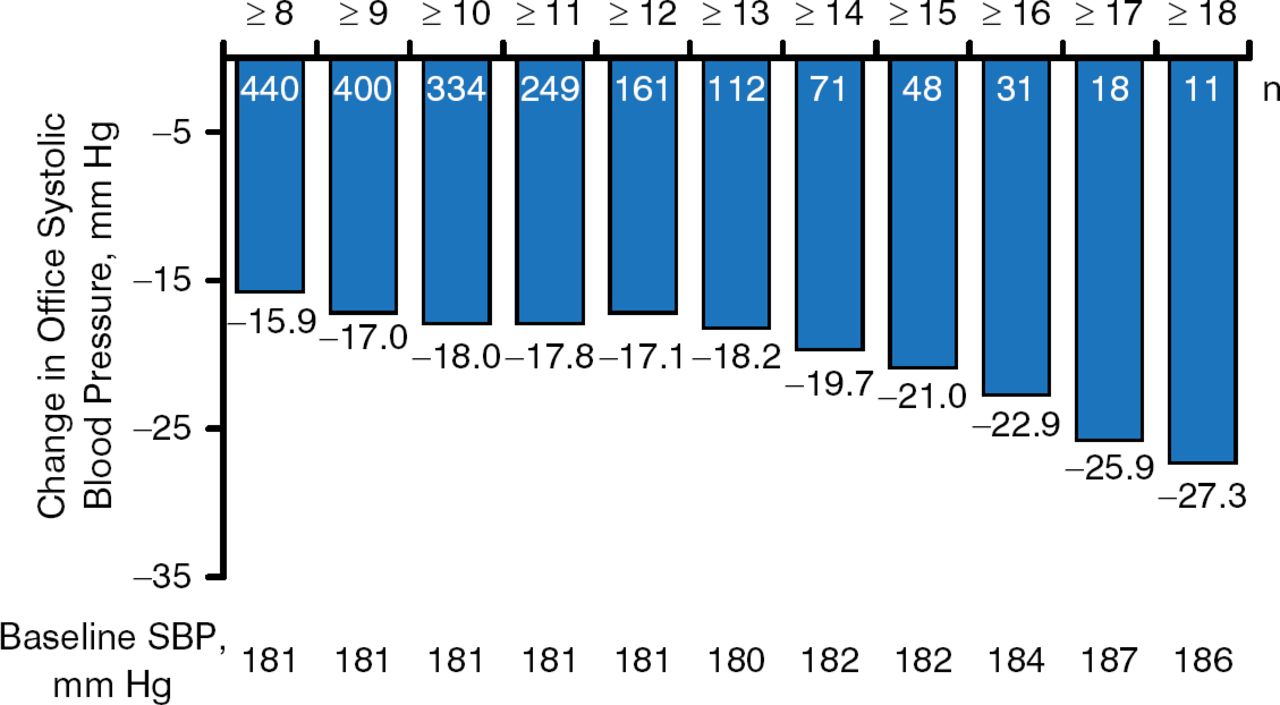
- Figure 3.
SBP Changes and No. of Ablations Attempted at 6 Months
SBP, systolic blood pressure.
Denervation and crossover subjects combined.
Reproduced with permission from DL Bhatt, MD.


Tools
Similar 12-Month BP Reductions with Renal Denervation and Sham Procedure
Permalink:


Table of contents
Cited By...
- No citing articles found.