

Article Figures & Data
Figures
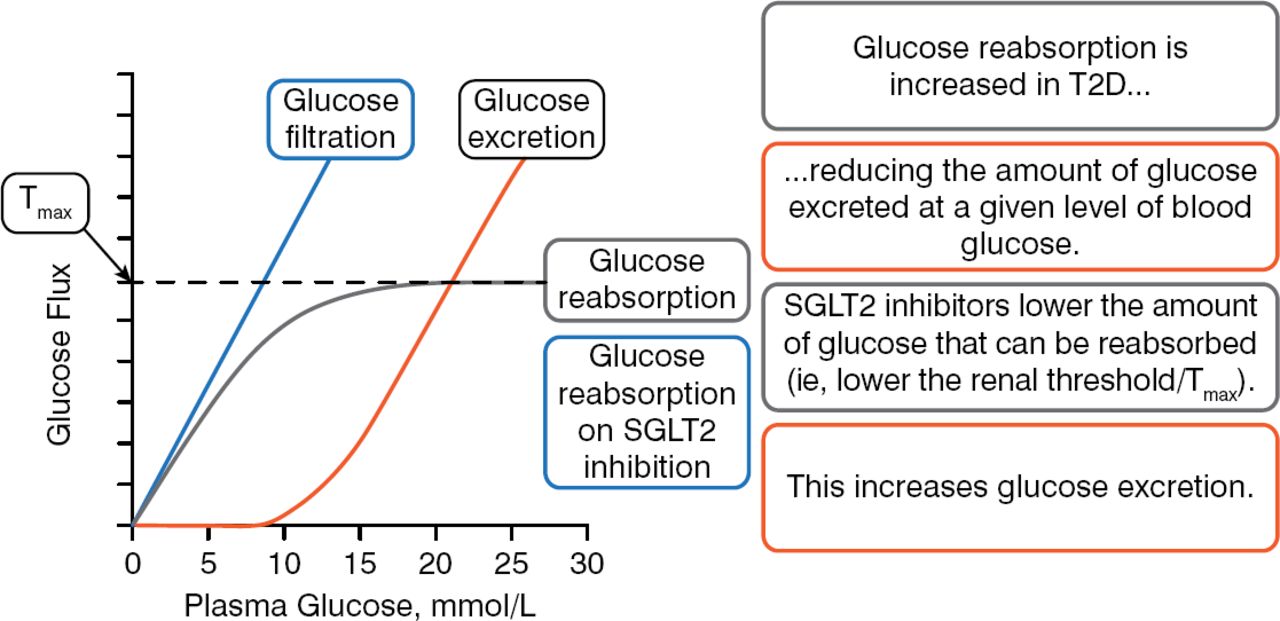
- Figure 1.
Renal Glucose Reabsorption and SGLT2 Inhibition
SGLT2, sodium glucose cotransporter 2; T2D, type 2 diabetes; Tmax, maximal renal tubule glucose reabsorption capacity.
Reproduced with permission from A Solini, MD, PhD.
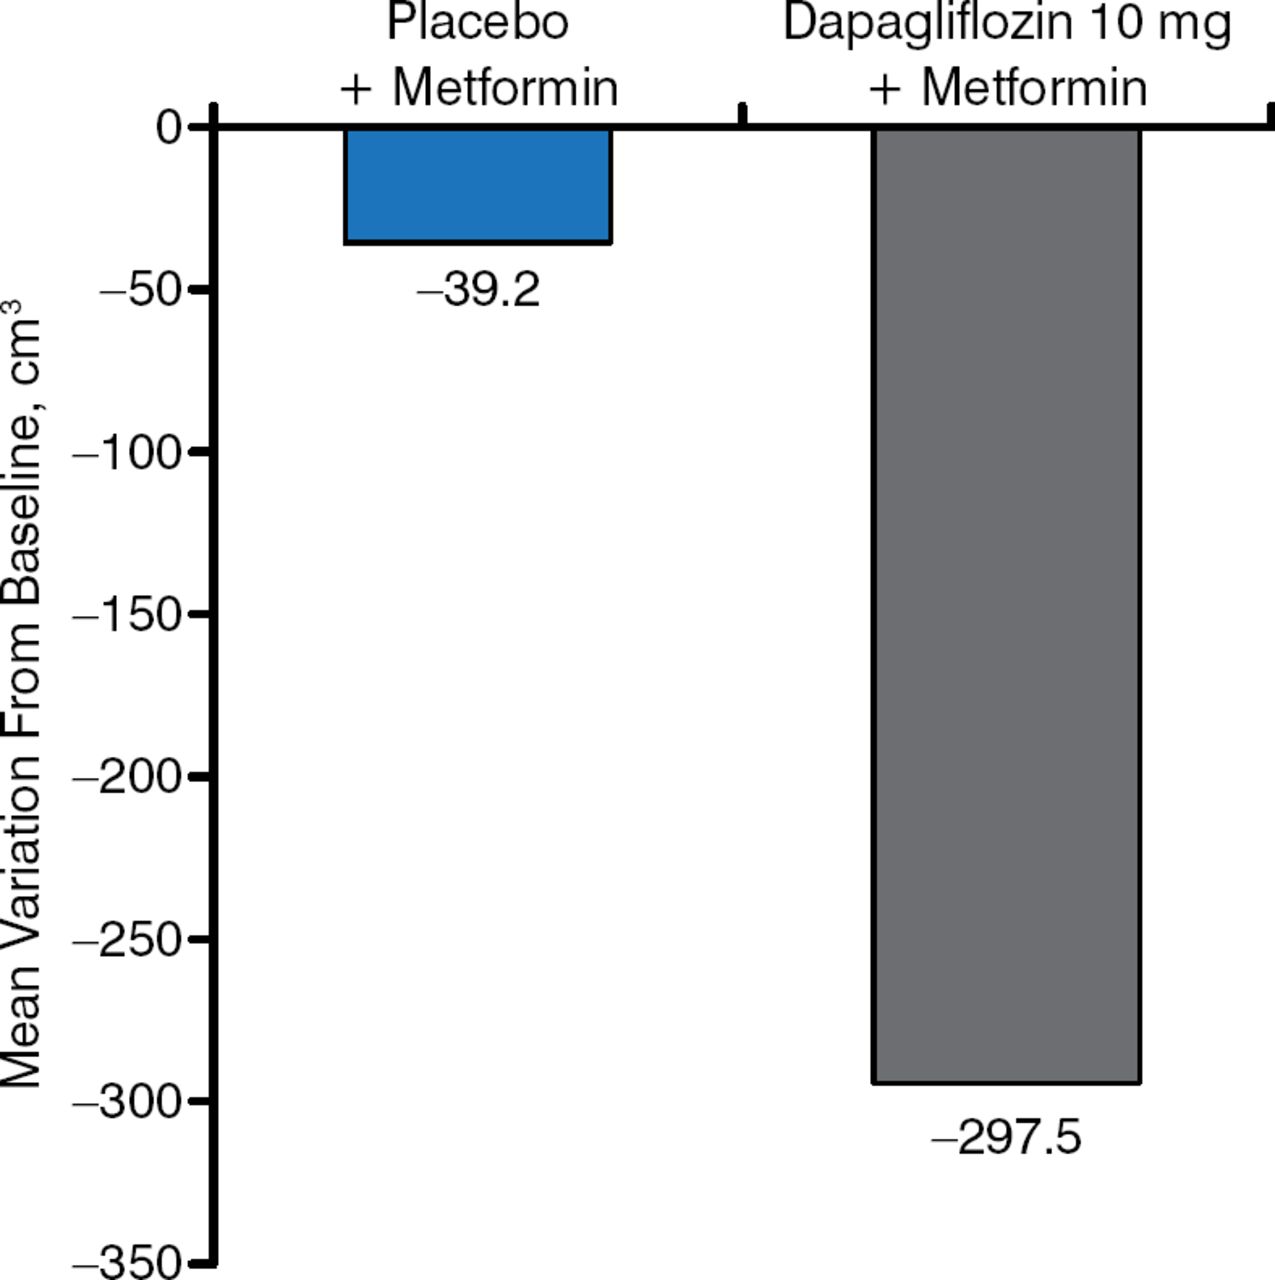
- Figure 2.
Change in Visceral Adipose Tissue as a Result of SGLT2 Inhibition
SGLT2, sodium glucose cotransporter 2.
Reproduced with permission from A Solini, MD, PhD.
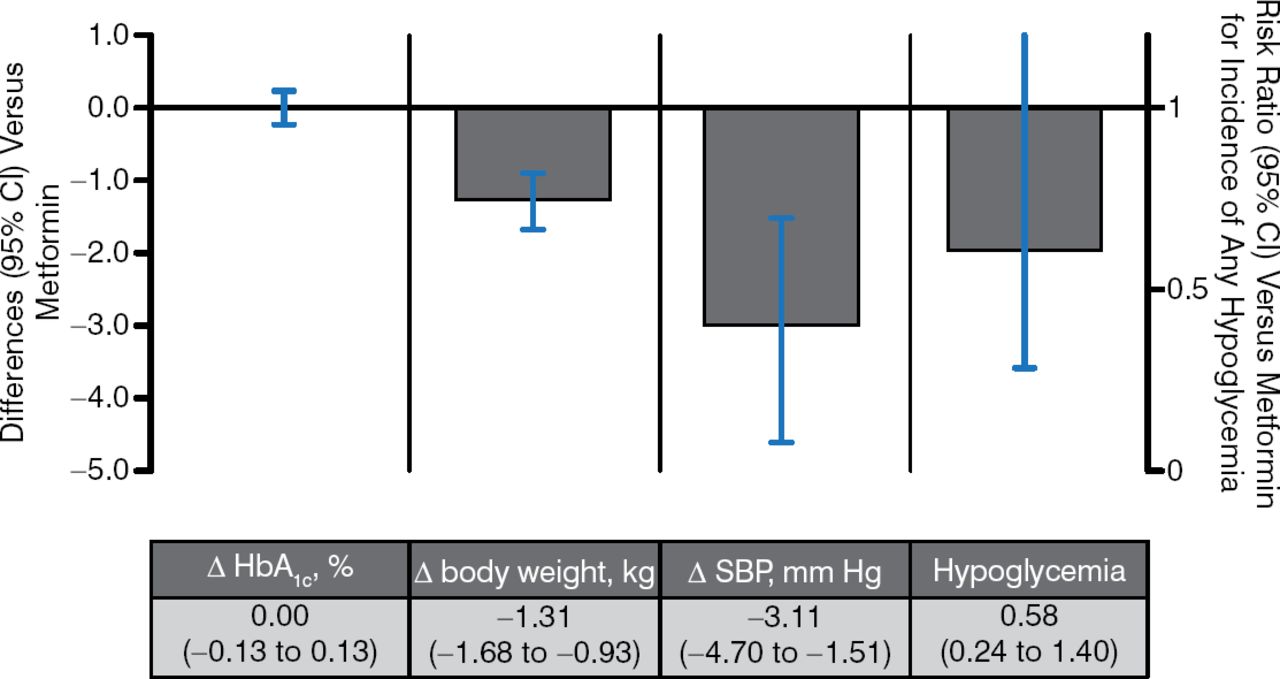
- Figure 3.
SGLT2 Inhibitors vs Metformin as Monotherapy
Δ, mean change from baseline vs metformin; SBP, systolic blood pressure; SGLT2, sodium glucose cotransporter 2.
Pooled results for 6 studies of SGLT2 inhibitors with ≥ 12 wk duration from published and gray literature sources through June 30, 2014 (search strategy adapted from Vasilakou et al. Ann Intern Med. 2013;159(4):262–274). Results are presented for the group allocated to the highest, most common dose among studies.
Reproduced with permission from A Tsapas, MD, PhD.
- Figure 4.
SGLT2 Inhibitors vs Sulfonylureas as Add-on Therapy to Metformin
Δ, mean change from baseline vs metformin; SBP, systolic blood pressure; SGLT2, sodium glucose contransporter 2.
Pooled results for 3 trials of SGLT2 inhibitors with ≥ 12 wk duration from published and gray literature sources through June 30, 2014 (search strategy adapted from Vasilakou et al. Ann Intern Med. 2013;159(4):262–274). Results are presented for the group allocated to the highest, most common dose among studies.
Reproduced with permission from A Tsapas, MD, PhD.
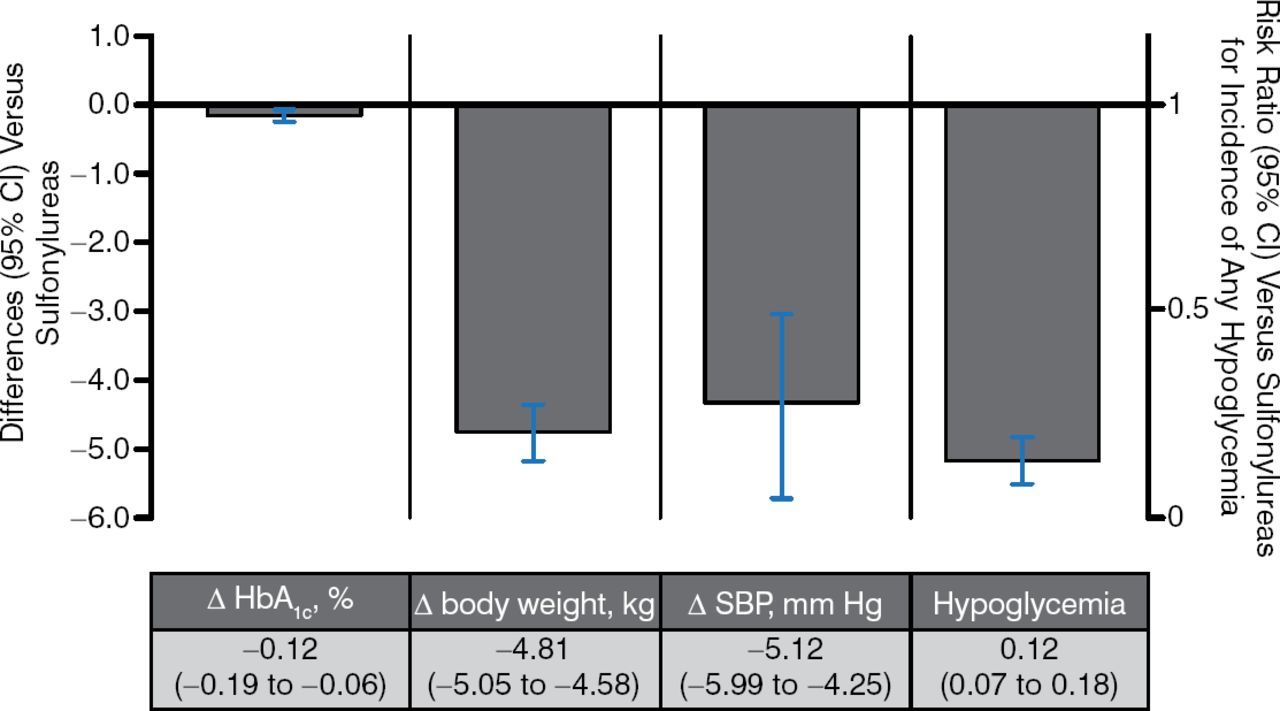
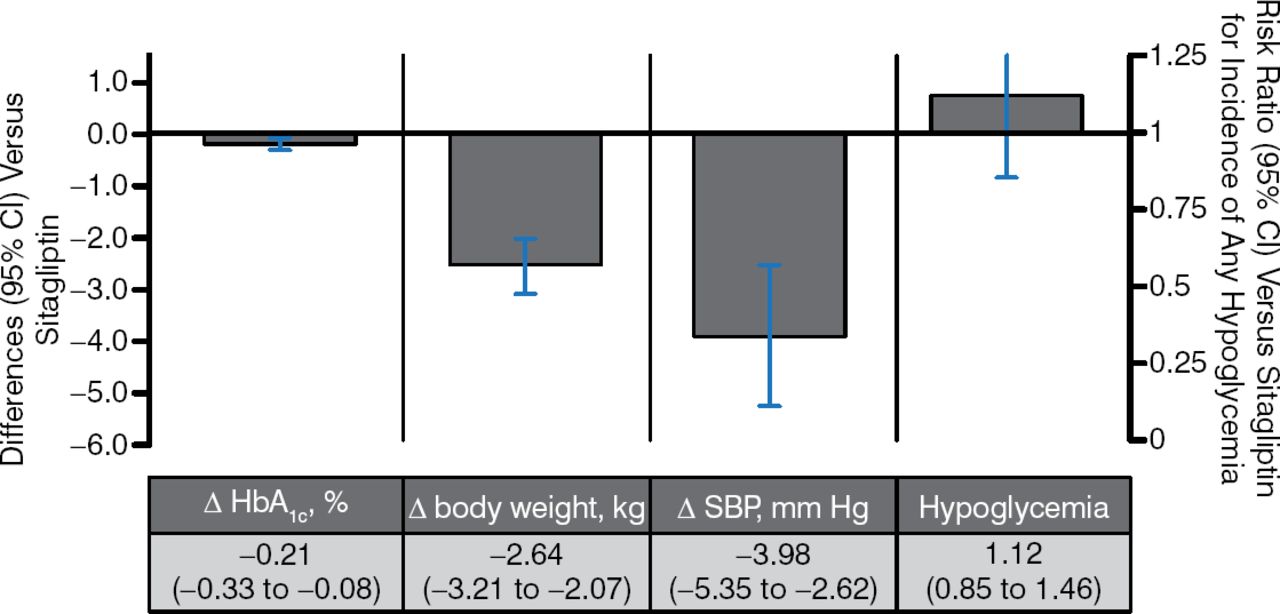
- Figure 5.
SGLT2 Inhibitors vs Sitagliptin as Add-on Therapy to Metformin
Δ, mean change from baseline vs metformin; SBP, systolic blood pressure; SGLT2, sodium glucose contransporter 2.
Pooled results for 5 trials of SGLT2 inhibitors with ≥ 12 wk duration from published and gray literature sources through June 30, 2014 (search strategy adapted from Vasilakou et al. Ann Intern Med. 2013;159(4):262–274). Results are presented for the group allocated to the highest, most common dose among studies.
Reproduced with permission from A Tsapas, MD, PhD
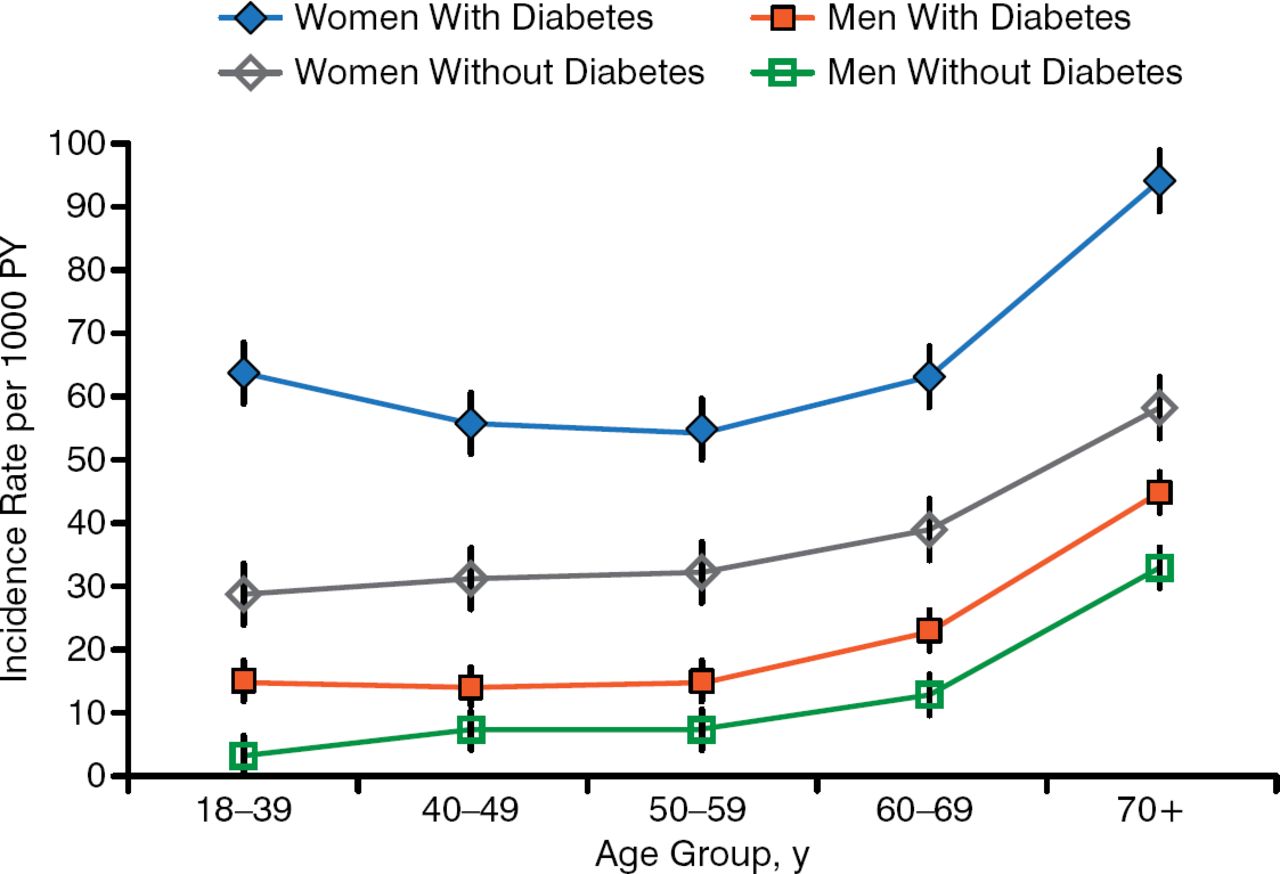
- Figure 6.
Incidence of UTI in Adults With T2DM
PY, person-year; T2DM, type 2 diabetes mellitus; UTI, urinary tract infection.
Reprinted from Journal of Diabetes and Its Complications, Vol. 26, Hirji I et al. Incidence of urinary tract infection among patients with type 2 diabetes in the UK General Practice Research Database (GPRD). Pages 513–516, Copyright 2012, with permission from Elsevier.


Tables
Tools
SGLT2 Inhibitors: A Comprehensive Evaluation of Mechanism of Action, Place in Therapy, and Urogenital Tolerability
Permalink:


Table of contents
Cited By...
- No citing articles found.