

Article Figures & Data
Figures
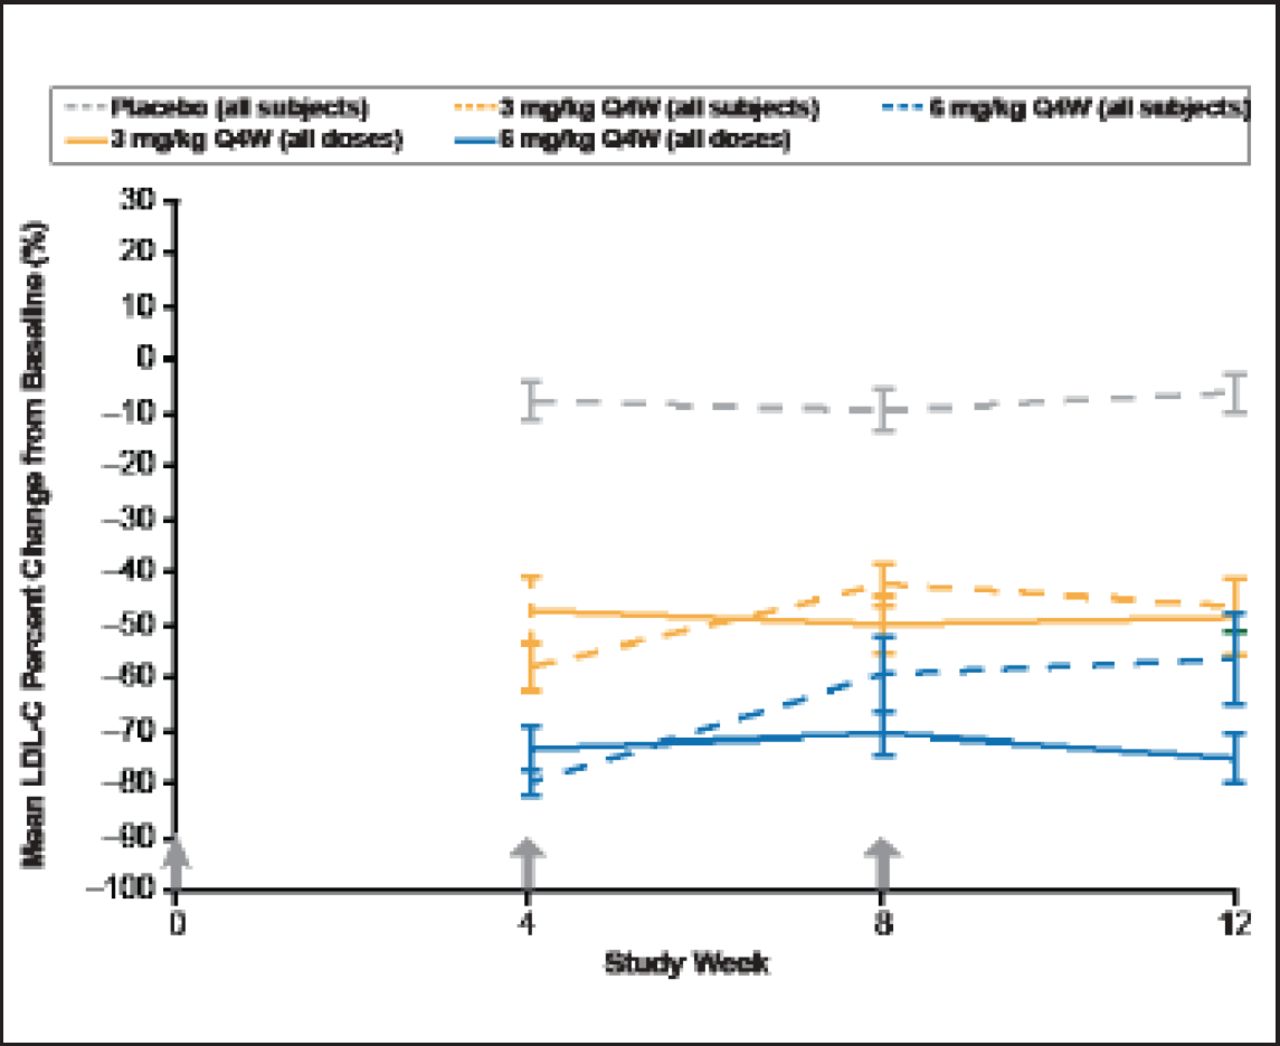
- Figure 1.
Mean LDL-C Percent Change from Baseline.
Values are mean ± SE; B1481005 and B1481012 data combined, modified ITT results; results include subjects who had dosing interrupted for LDL-C ≤25 mg/dL; * p<0.05; **p<0.001
Reproduced with permission from B Gumbiner, MD.

Tools
Effects of 12 Weeks of Treatment with RN316 (PF-04950615) in Hypercholesterolemic Subjects on High and Maximal Dose Statins
Permalink:


Table of contents
Cited By...
- No citing articles found.