

Article Figures & Data
Figures
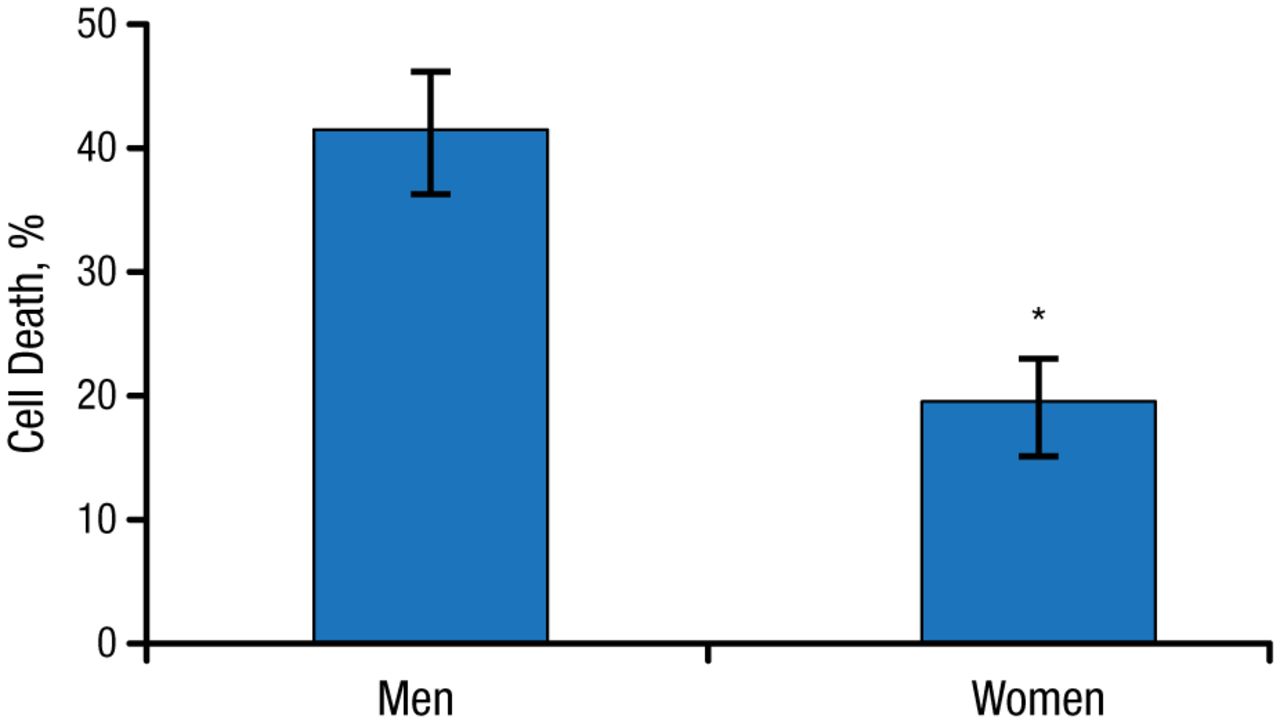
- Figure 1.
Sex-Related Differences in How Brain Cells React to Ischemia
*P < .05.
Adapted by permission from Macmillan Publishers Ltd: J Cerebr Blood F Met. Liu M et al. Role of P450 aromatase in sex-specific astrocytic cell death. 2007;27:135–141. Copyright 2007.
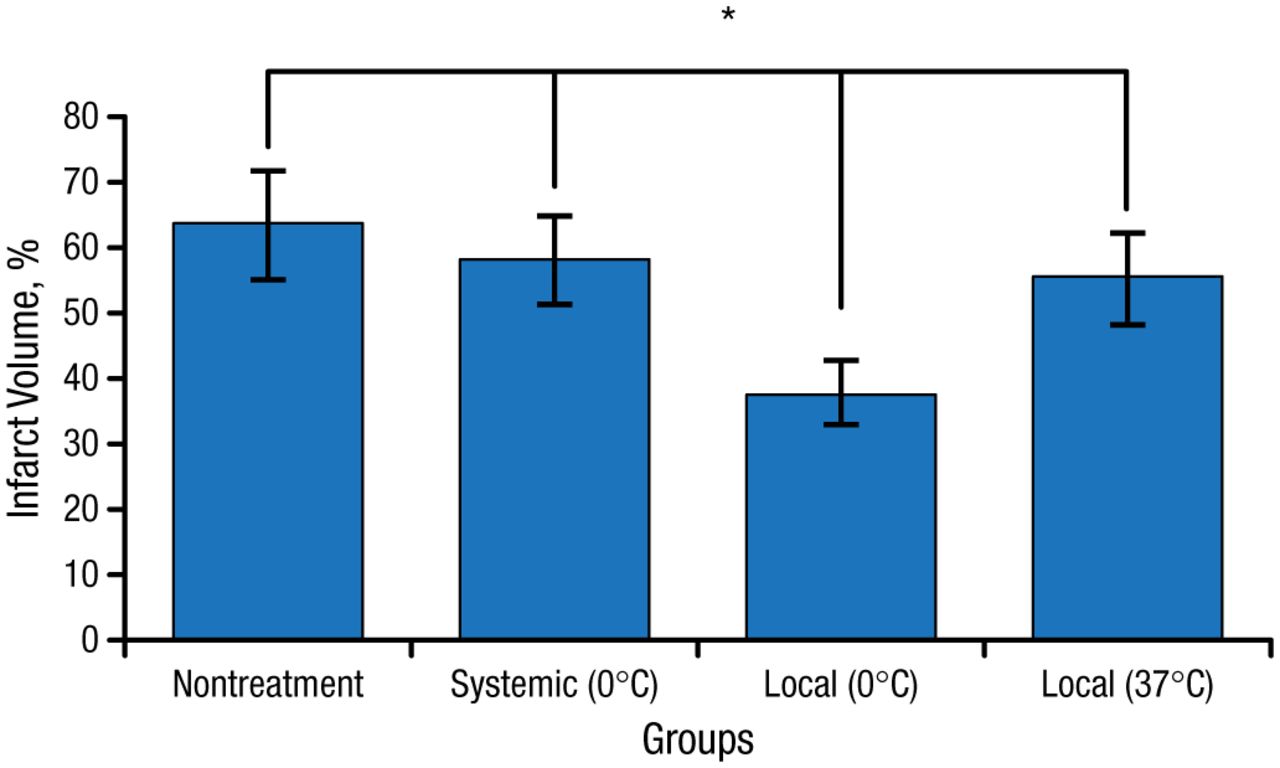
- Figure 2.
Treatment-Related Differences in Infarct Volume in Rodents
*P < .01
Republished with permission of W. S. Maney & Sons Ltd, from Chen J et al. The effect of a microcatheter-based selective intra-arterial hypothermia on hemodynamic changes following transient cerebral ischemia. Neurol Res. 2015;37:263–268; permission conveyed through Copyright Clearance Center, Inc.
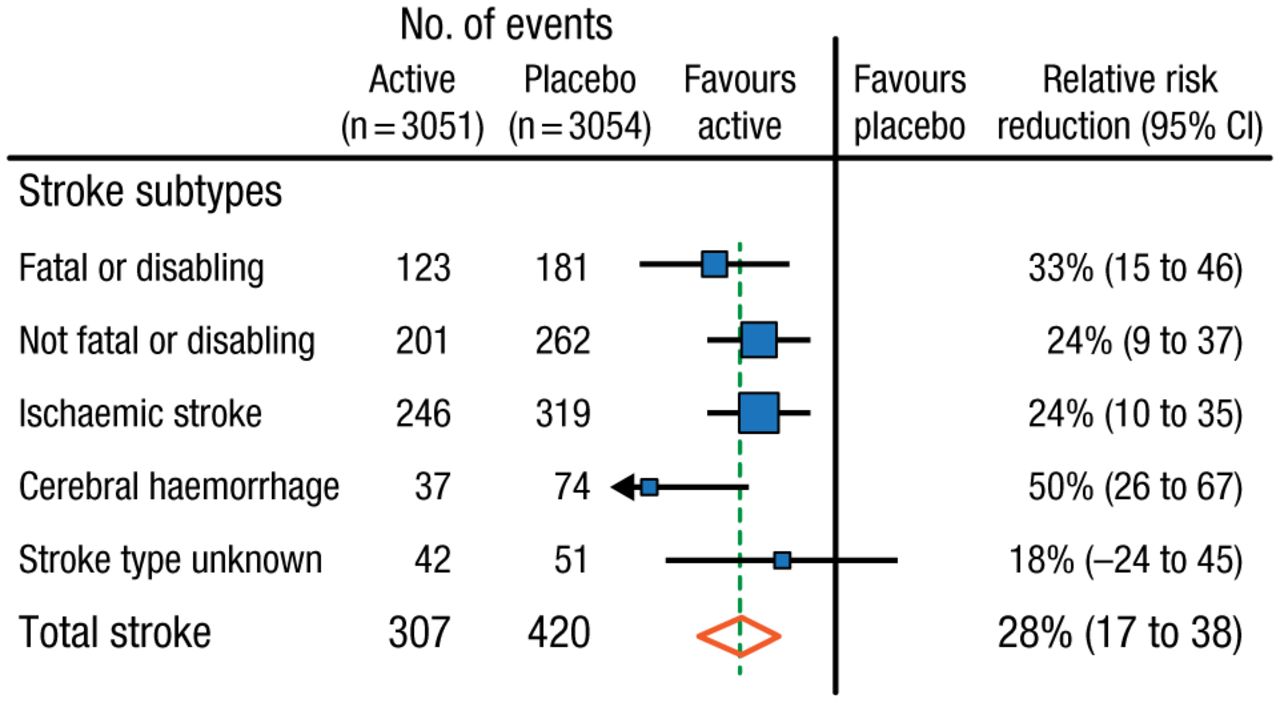
- Figure 3.
The Effect of Blood Pressure Reduction on Stroke Subtypes
Blue squares = point estimates (with area proportional to number of events); horizontal lines = 95% CIs; diamonds = point estimate and 95% CI for overall effects; vertical broken line = point estimate for overall effect.
Reprinted from The Lancet, PROGRESS Collaborative Group, Randomized trial of a perindopril-based blood-pressure-lowering regimen among 6105 individuals with previous stroke or transient ischaemic attack. 2001;358:1033–1041. Copyright with permission from Elsevier.
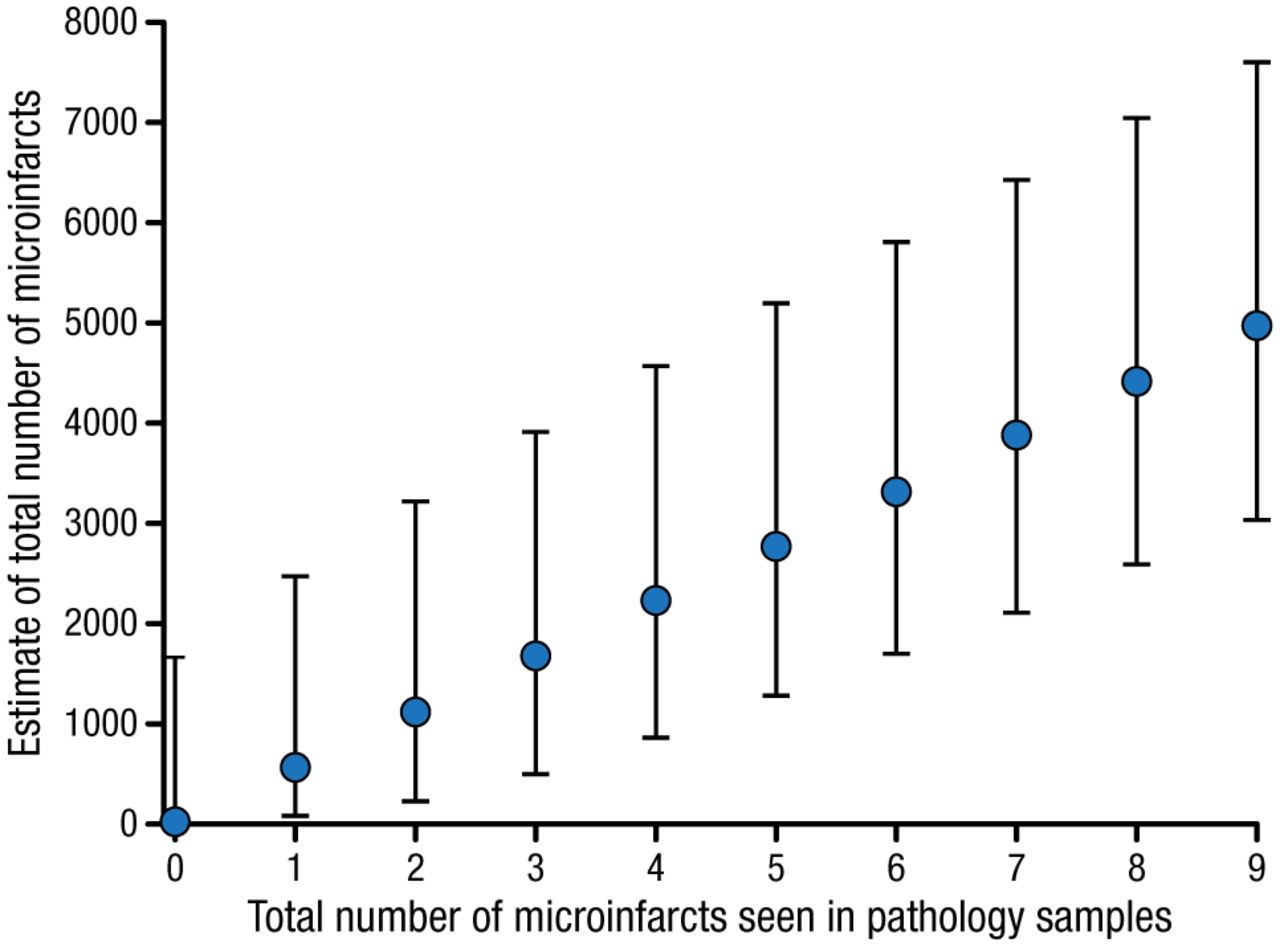
- Figure 4.
Microinfarct No. in a Brain Sample Correlates With Whole-Brain Microinfarct Burden
Maximum likelihood estimates (blue filled circles) with 90% CIs of the total number of microinfarcts within the brain volume vs total number of microinfarcts seen in routine pathologic specimens.
Reprinted from Westover MB et al. Estimating cerebral microinfarct burden from autopsy samples. Neurology. 2013;80:1365–1369. With permission from American Academy of Neurology.


Tools


Table of contents
Cited By...
- No citing articles found.