

Article Figures & Data
Figures
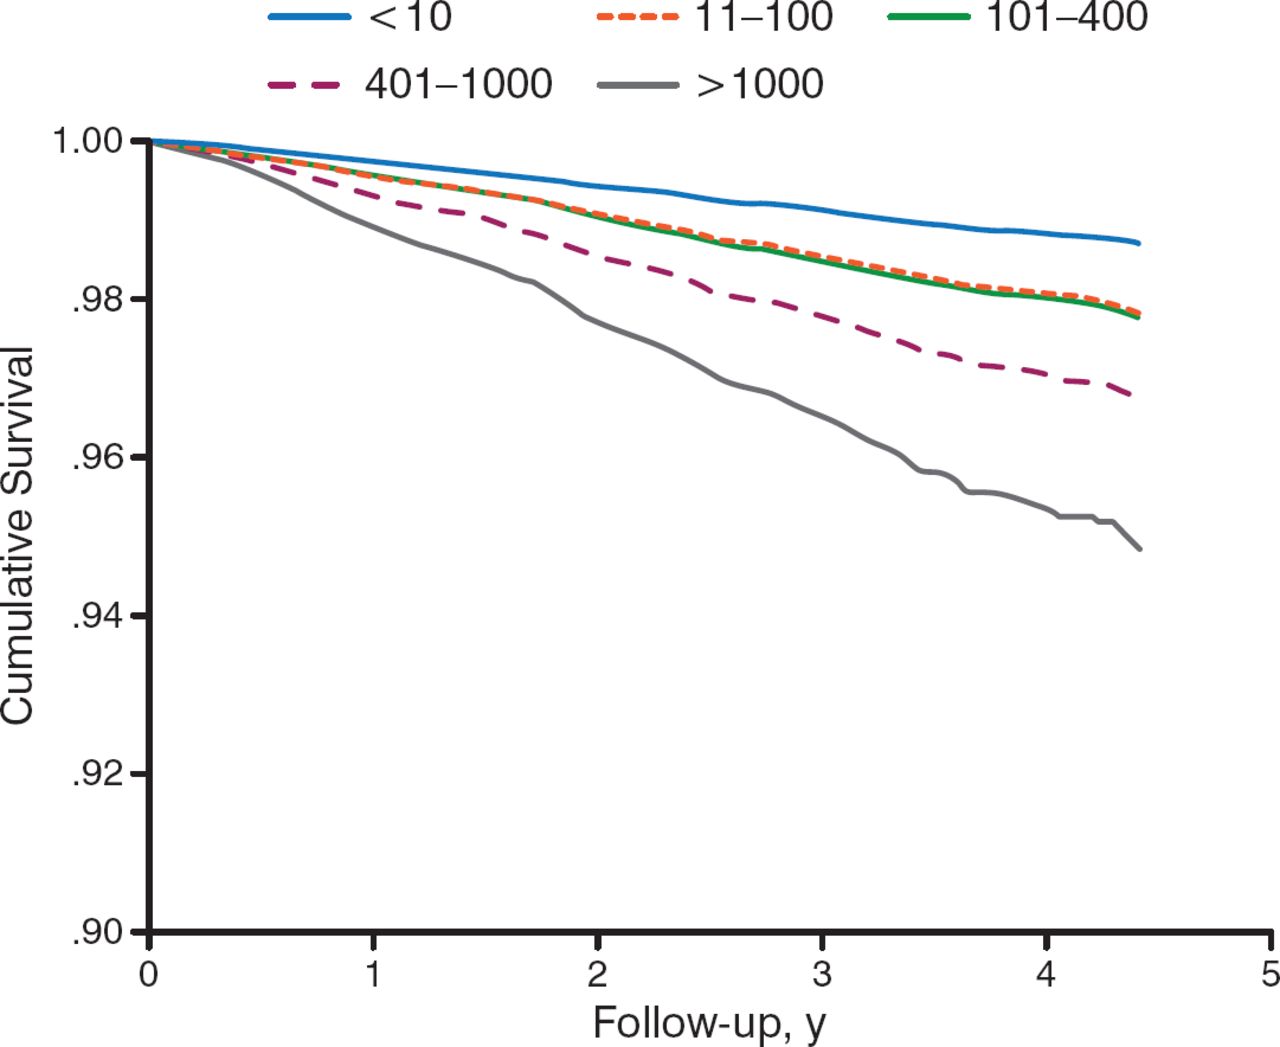
- Figure 1.
Coronary Calcium Score Independent Predictor of All-Cause Mortality
Graph shows risk-adjusted all-cause survival estimates according to calcium score subsets. Even after adjustment, survival rate is proportionally worse as the baseline calcium score increases.
Adapted from Shaw LJ et al. Graph shows risk-adjusted all-cause sur vival estimates accord i ng to calcium score subsets. Even after adjustment, survival rate is proportionally worse as the baseline calcium score increases. Radiology, 2003;228:826–833. With permission from RSNA.
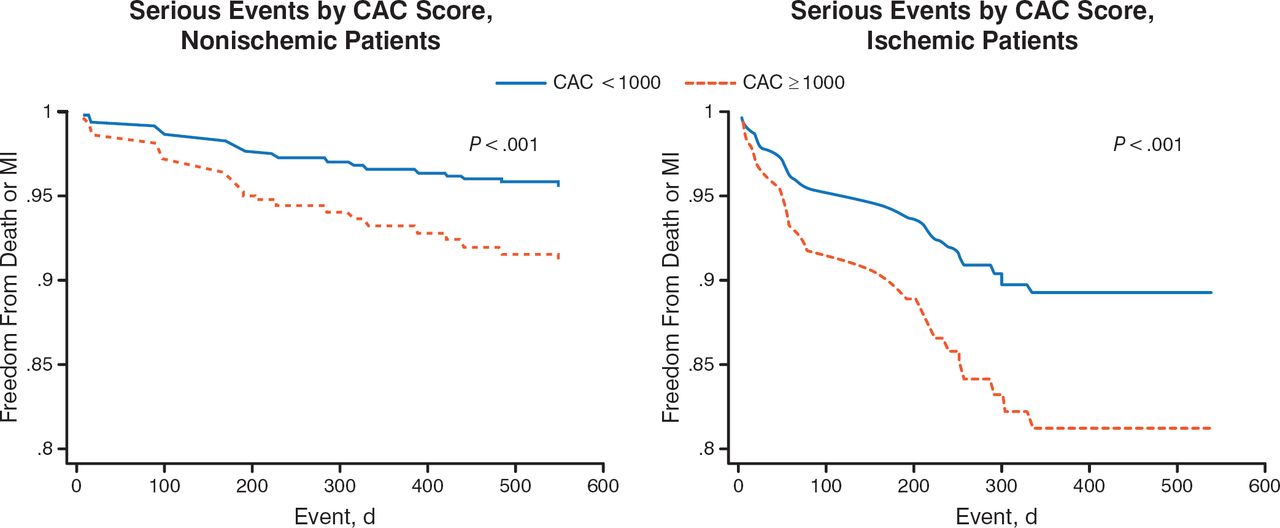
- Figure 2.
High CAC Score Better Predictor of Poor Outcome Than Presence of Ischemia
CAC, coronary artery calcium; MI, myocardial ischemia.
Adapted from Schenker MP et al. Interrelation of coronary calcification, myocardial ischemia, and outcomes in patients with intermediate likelihood of coronary artery disease: a combined positron emission tomography/computed tomography study. Circulation. 2008;117(13):1693–1700. With permission from American Heart Association.


Tools


Table of contents
Cited By...
- No citing articles found.