

Article Figures & Data
Figures
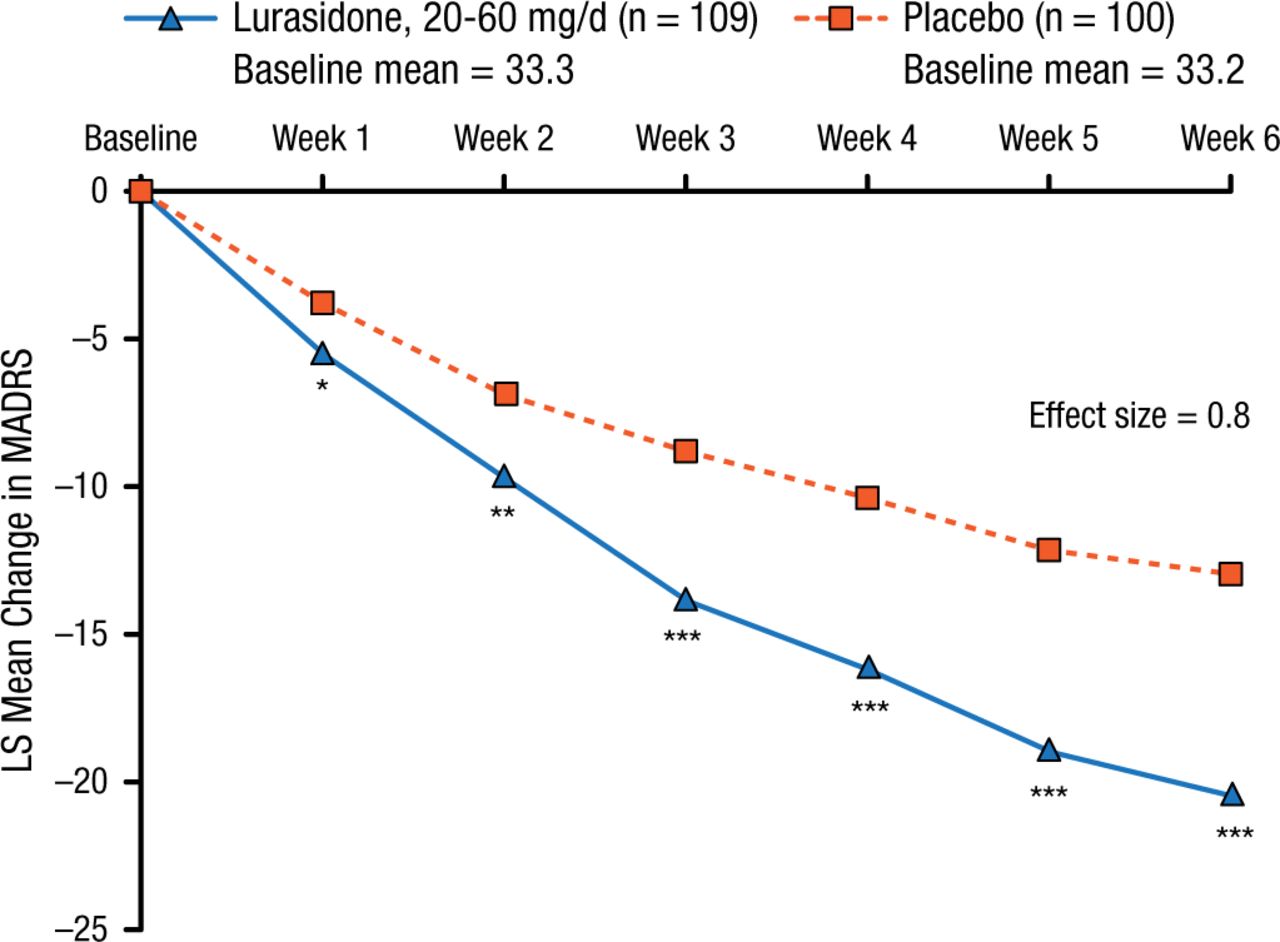
- Figure 1.
Change in MADRS Score
Mixed model for repeated measures analysis (modified intent-to-treat population).
LS, least squares; MADRS, Montgomery-Asberg Depression Rating Scale.
*P < .05; **P < .01; ***P < .0001.
Reproduced with permission from T Suppes, MD, PhD.

Tools
Lurasidone Effective in Major Depressive Disorder With Mixed Features
Permalink:


Table of contents
Cited By...
- No citing articles found.