

Article Figures & Data
Figures
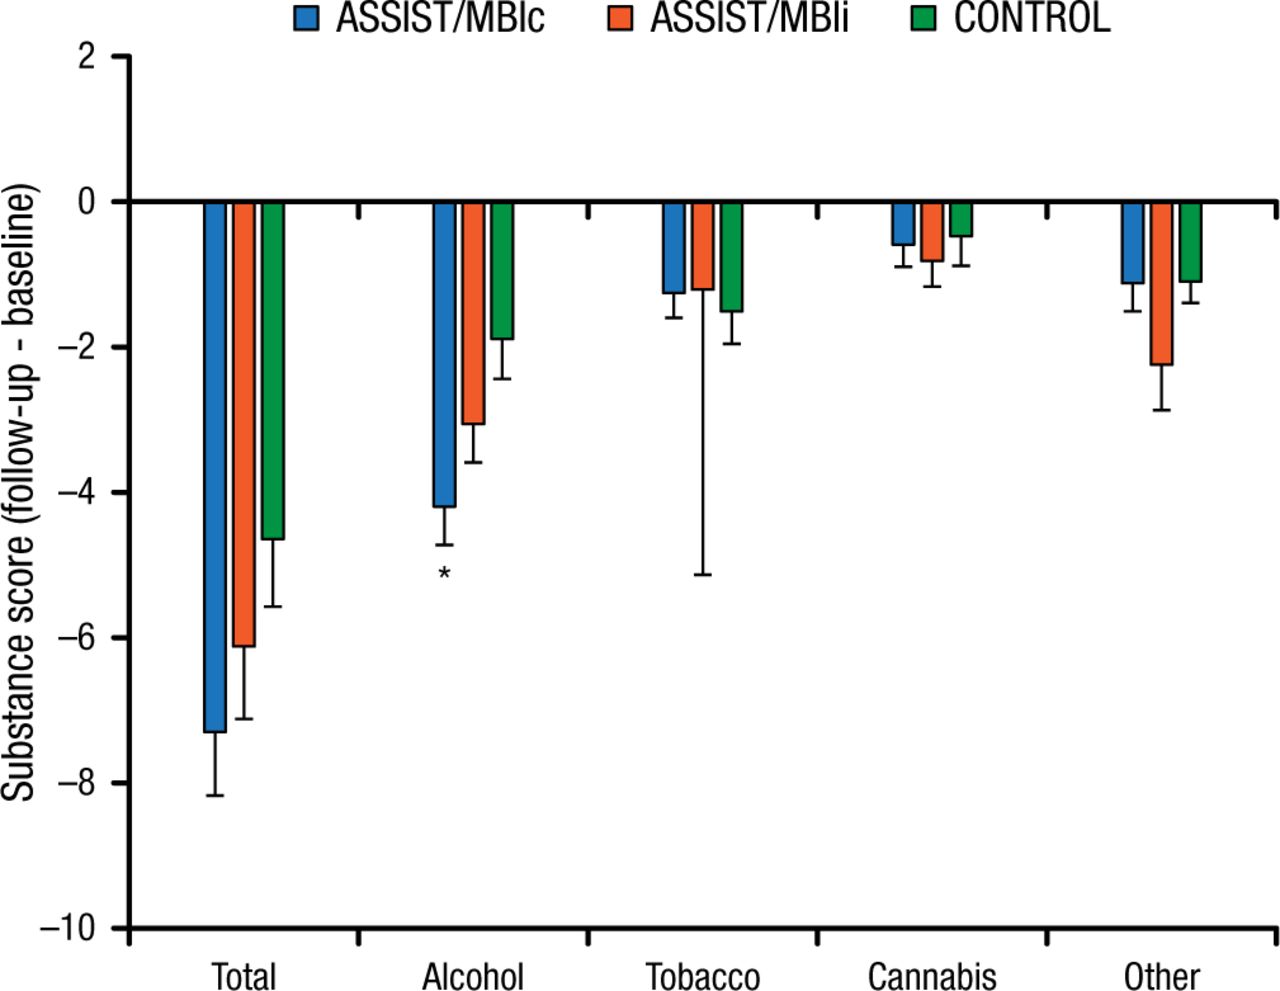
- Figure 1.
Effect of Intervention on Alcohol, Smoking, and Substance Involvement Screening Test Scores
Specific substance ASSIST scores at follow-up relative to baseline in college students. The data are expressed as mean ± standard error of the involvement scores in the three groups: ASSIST/MBIc, ASSIST/MBIi, and control. From the left to right the bars represent total involvement score, alcohol, tobacco, marijuana, and summation of the scores for other drugs. The symbol “*” represents a significant difference (P ≤ .05, ANOVA followed by Newman–Keuls test) compared with control.
Reprinted from Addict Behav, Vol. 45, Christoff AO et al. Reducing substance involvement in college students: A three-arm parallel-group randomized controlled trial of a computer-based intervention. Pages No. 164-171, Copyright (2015), with permission from Elsevier.

Tools


Table of contents
Cited By...
- No citing articles found.