

Article Figures & Data
Figures
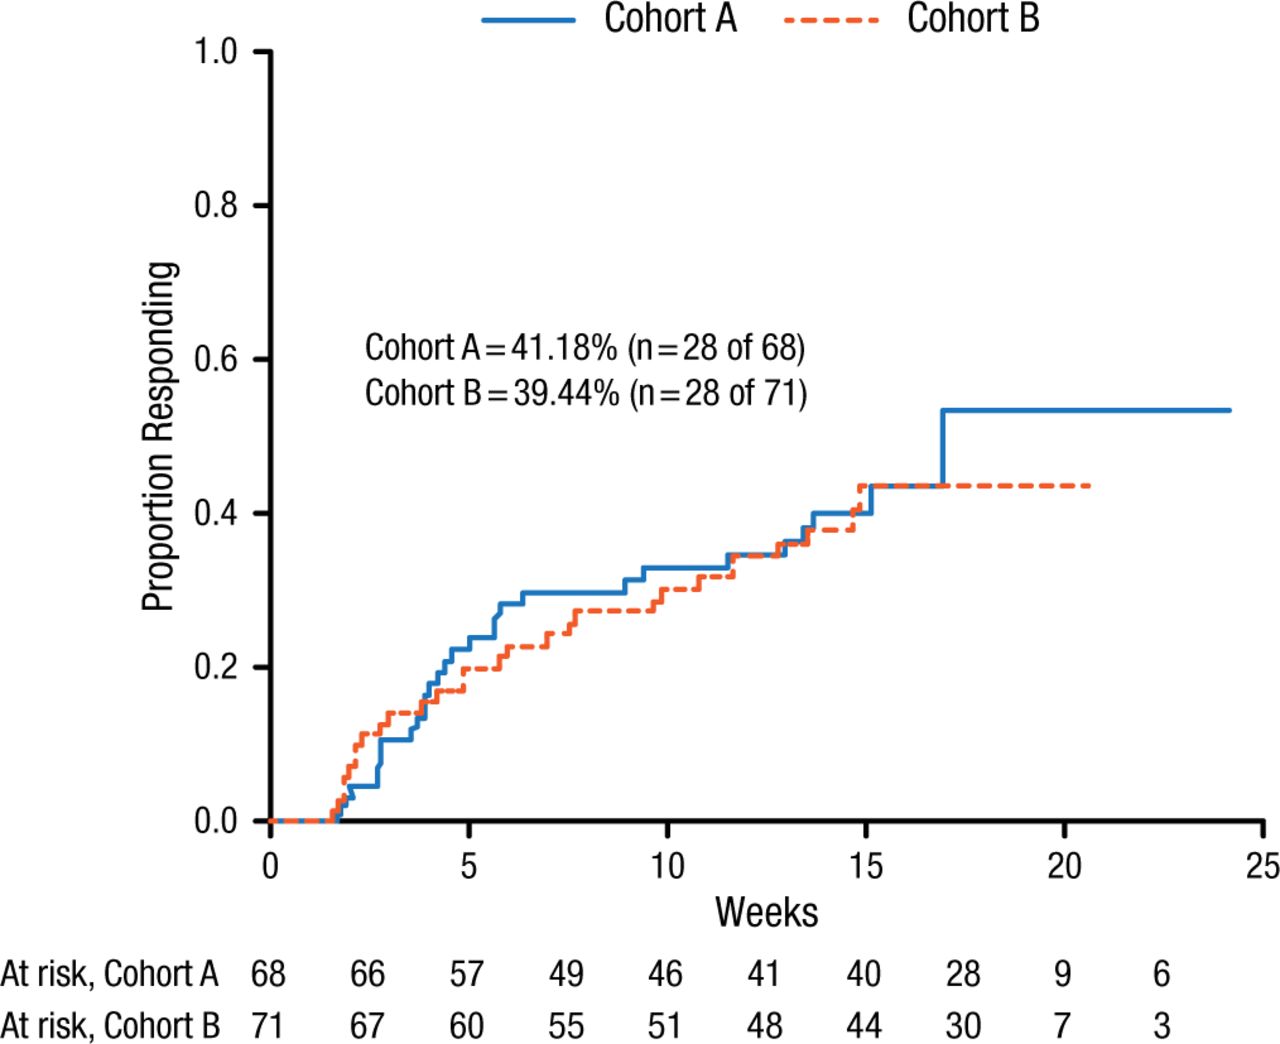
- Figure 1.
Response Rate in Phase 2 of the ADAPT Study
Cohorts A and B represent the 2 cohorts in the second phase of the study (cohorts remain blinded at this time).
Reproduced with permission from JF Karp, MD.

Tools


Table of contents
Cited By...
- No citing articles found.