

Article Figures & Data
Figures
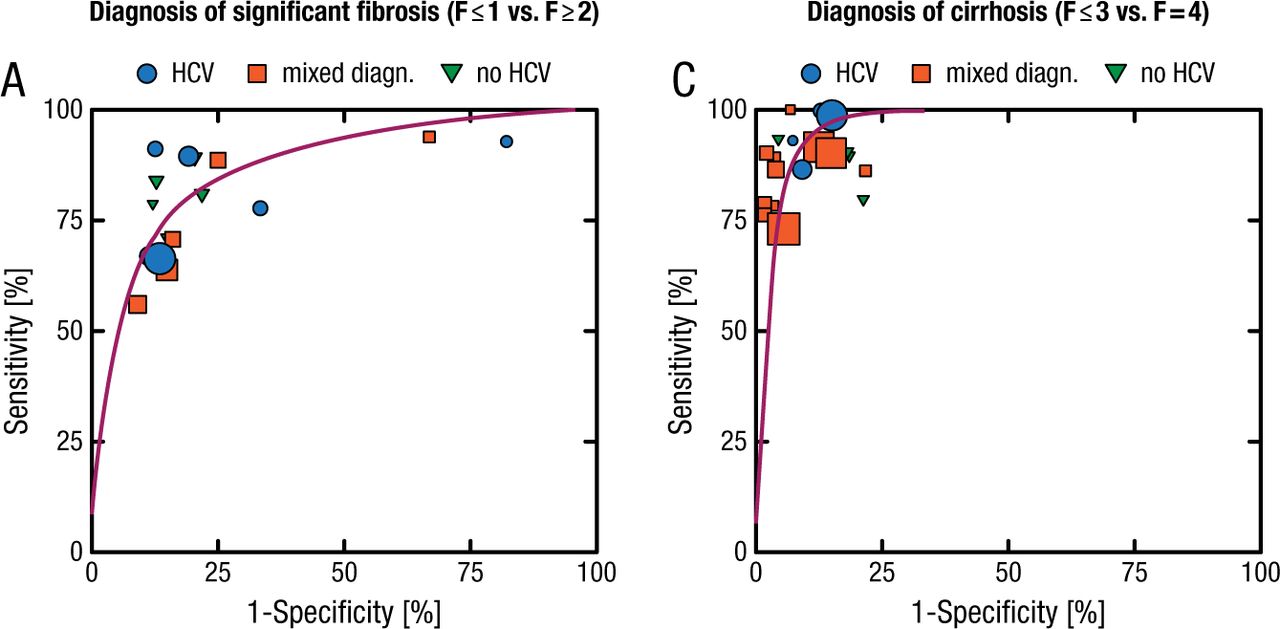
- Figure 1.
Performance of Transient Elastography vs Blood Tests
(A) SROC for F > 2, (C) F = 4. The size of the dots for 1-specificity and sensitivity of the single studies in the ROC space is derived from the respective sample size. (A–C) •, HCV; ■, mixed diagnosis; ▼, no HCV.
Reprinted from Gastroenterology, Vol. 134, Friedrich-Rust M et al, Performance of Transient Elastography for the Staging of Liver Fibrosis: A Meta-Analysis Pages No. 960-974, Copyright (2008), with permission from AGA Institute.

Tables
Tools


Table of contents
Cited By...
- No citing articles found.