

Article Figures & Data
Figures
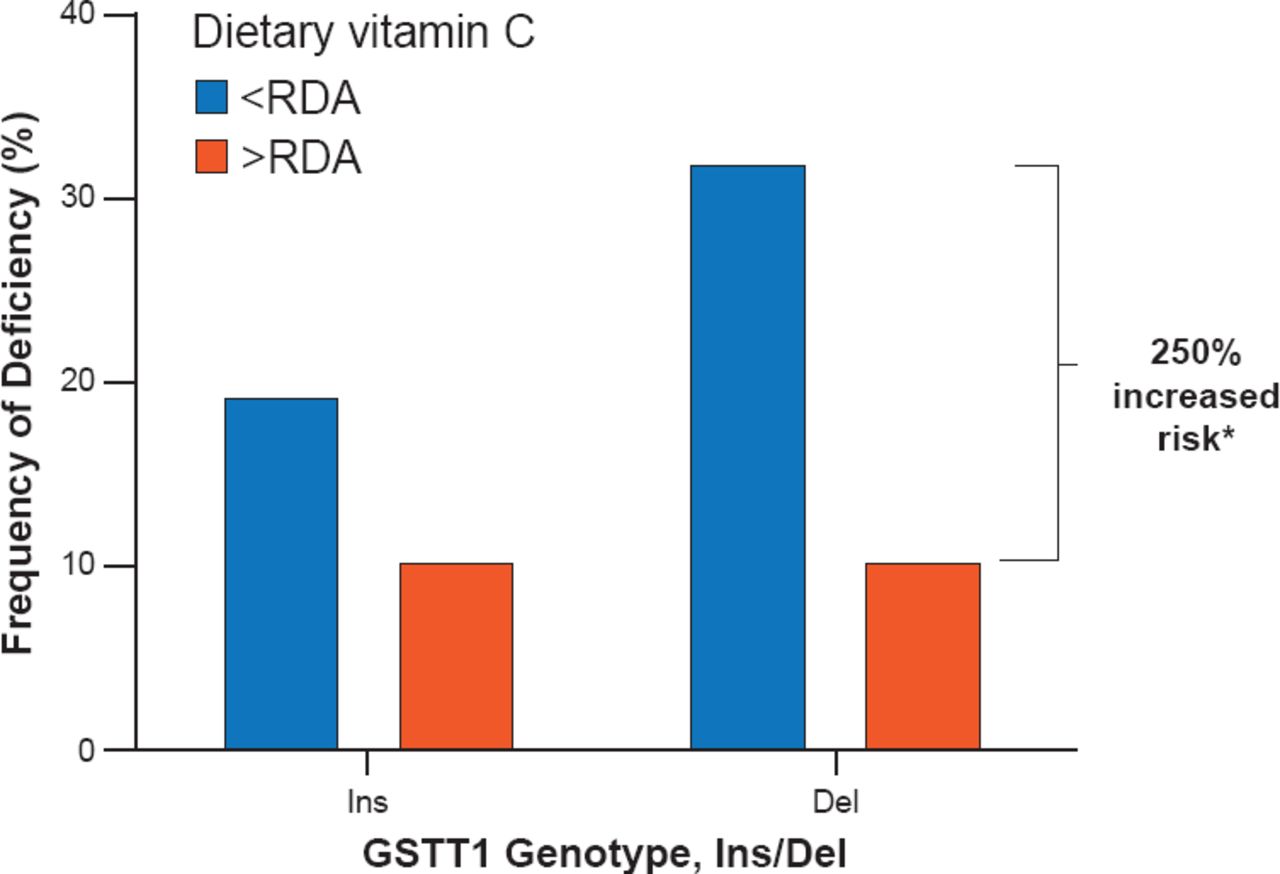
- Figure 1.
GSTT1 Genotype, Vitamin C Adequacy and Ascorbic Acid Deficiency
*Relative risk of deficiency for those with the “deletion” variant who do not meet the RDA for vitamin C compared with those who do meet the RDA.
Del=deletion; INS=insertion; RDA=recommended daily allowance.
Reproduced from Cahill LE et al. Intake of carbohydrates compared with intake of saturated fatty acids and risk of myocardial infarction: importance of the glycemic index. Am J Clin Nutr 2009;90(5)1411–1417. With permission from the American Society for Nutrition.
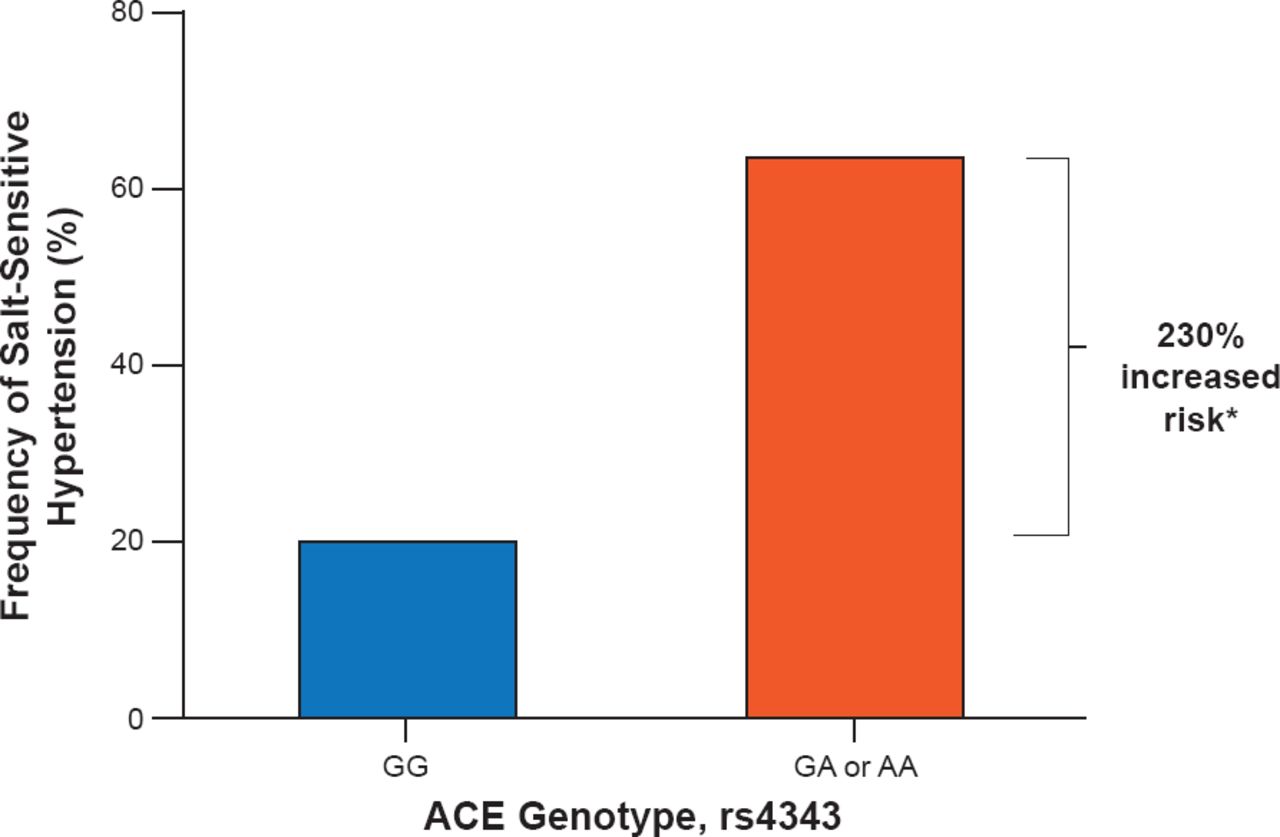
- Figure 2.
Salt-Sensitive Hypertension by ACE Genotype
*Relative risk of salt-sensitive hypertension with the GA or AA genotype compared with the GG genotype.
Reproduced from Poch & et al. Hypertension 2001. With permission from the American Society for Nutrition.
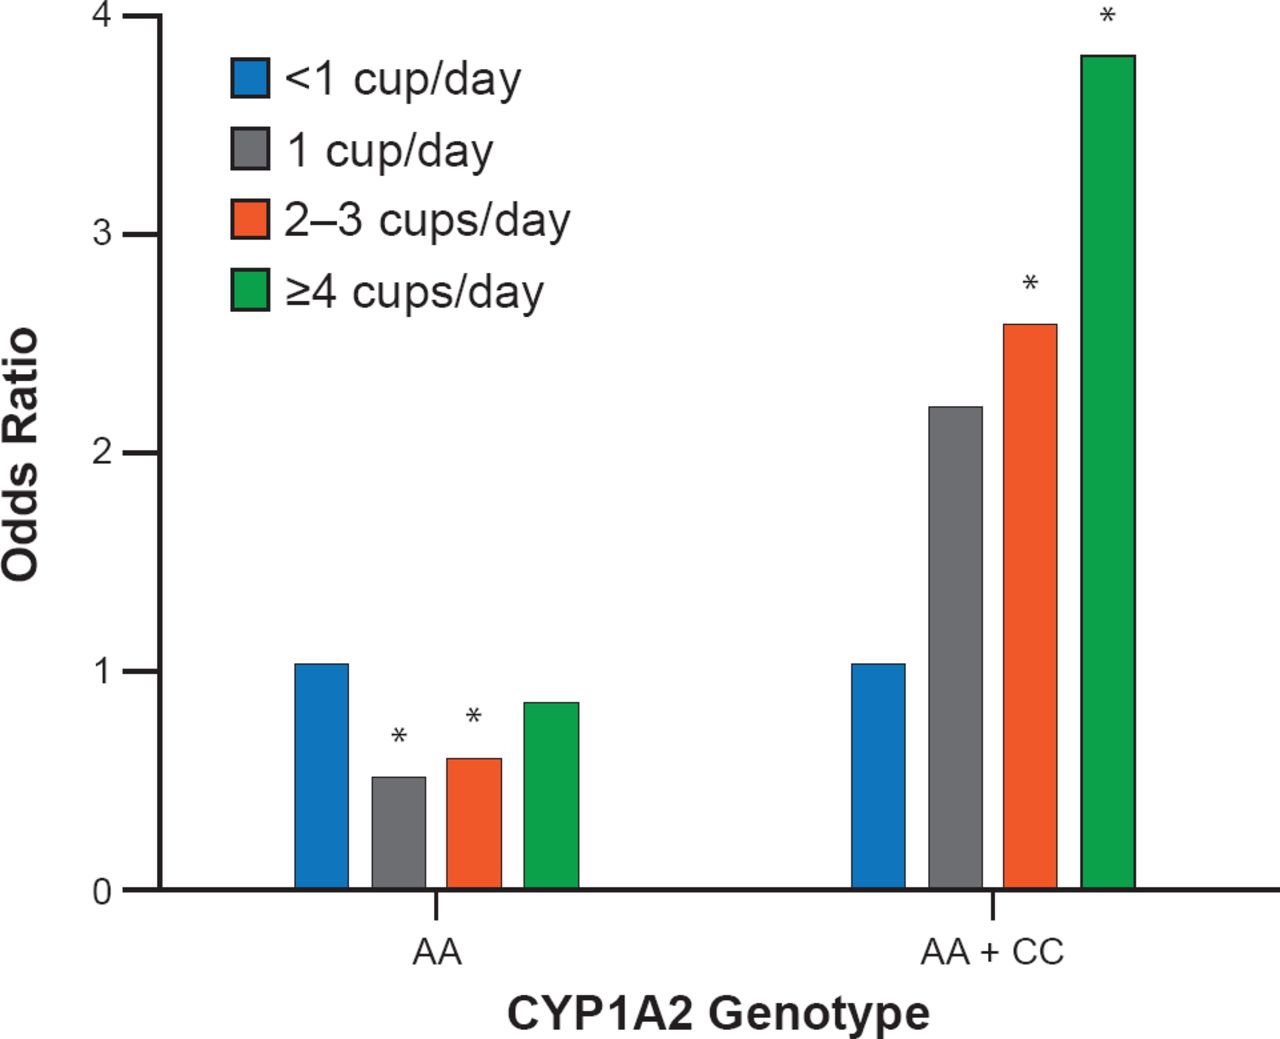
- Figure 3.
Coffee Intake, MI, and CYP1A2 Genotype
*p<0.05.
Reproduced with permission from Cornelius MC et al. JAMA 2006. With permission from the American Society for Nutrition.


Tools
Use of Personalized Nutrition Based on Genetic Polymorphisms to Reduce Disease Risk
Permalink:


Table of contents
Cited By...
- No citing articles found.