

Article Figures & Data
Figures
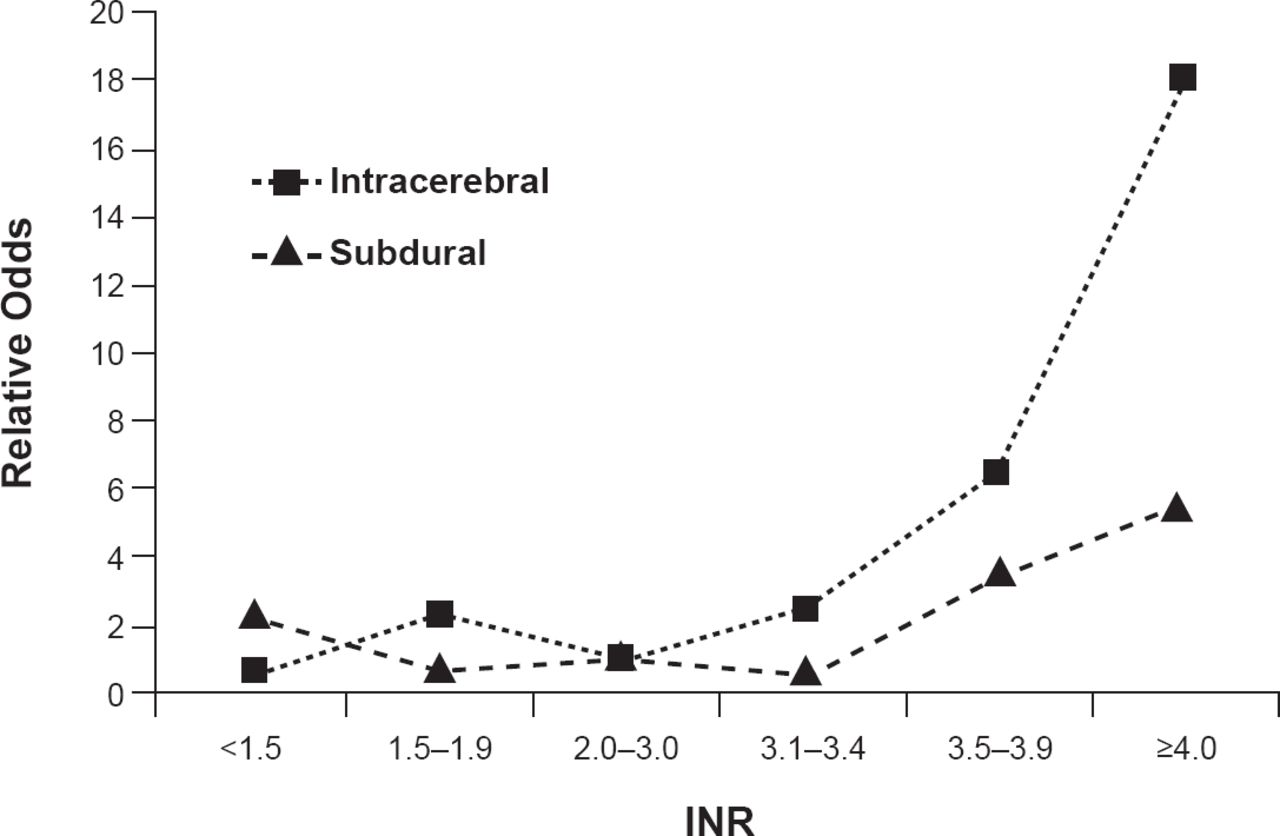
- Figure 1.
Warfarin and INR as ICH Risk Factors
INR=international normalized ratio.
Reproduced from Fang MC et al. Advanced Age, Anticoagulation Intensity, and Risk for Intracranial Hemorrhage Among Patients Taking Warfarin for Atrial Fibrillation. Ann Int Med 2004;141(10):745–752. With permission from the American College of Physicians.
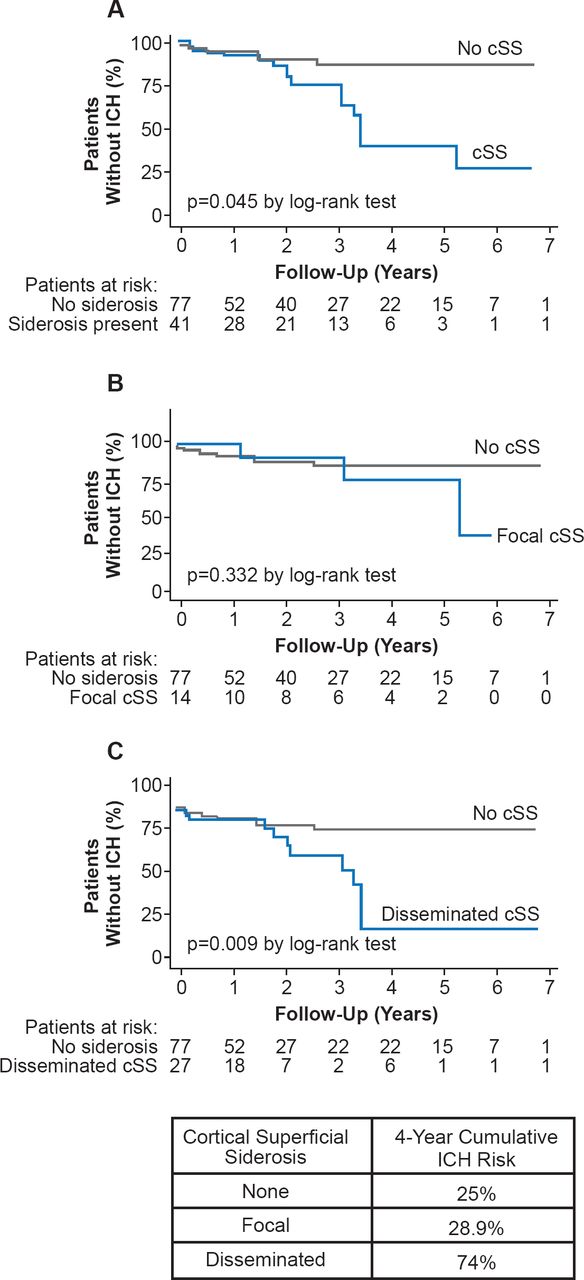
- Figure 2.
Cortical Superficial Siderosis and Risk of Intracerebral Hemorrhage in Cerebral Amyloid Angiopathy
cSS=cortical superficial siderosis; ICH=intracerebral hemorrhage.
Reproduced from Charidimou A et al. Cortical superficial siderosis and intracerebral hemorrhage risk in cerebral amyloid angiopathy. Neurology 2013;81(19);1666–1673. With permission from Lipincott Williams and Wilkins.
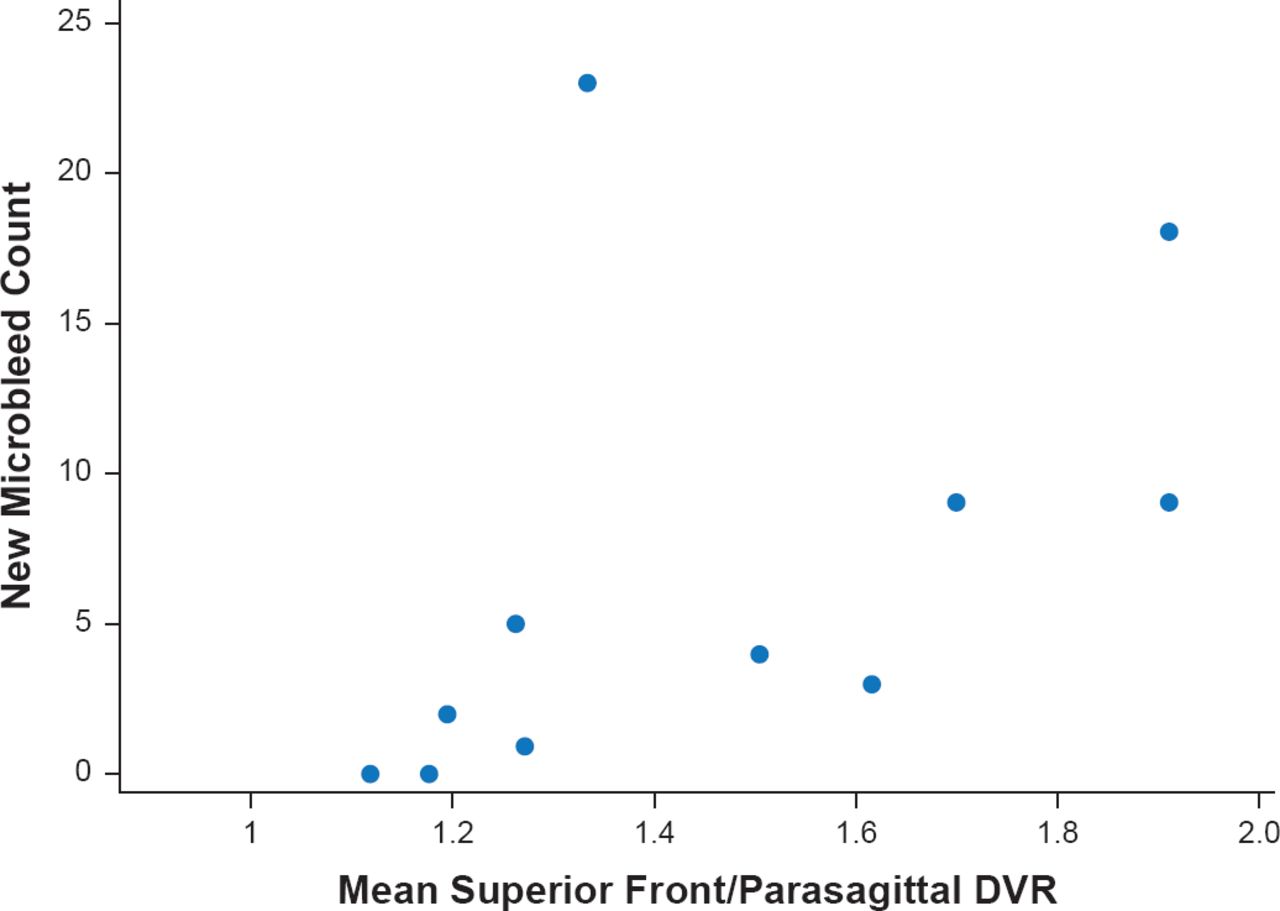
- Figure 3.
Pittsburgh Compound B PET Predicts CAA-Related Hemorrhages
DVR=distribution volume ratio; PET=positron emission tomography
Reproduced from Gural ME et al. Predicting sites of new hemorrhage with amyloid imaging in cerebral amyloid angiopathy. Neurology 2012;79(4):320–326. With permission from Lipincott Williams and Wilkins.
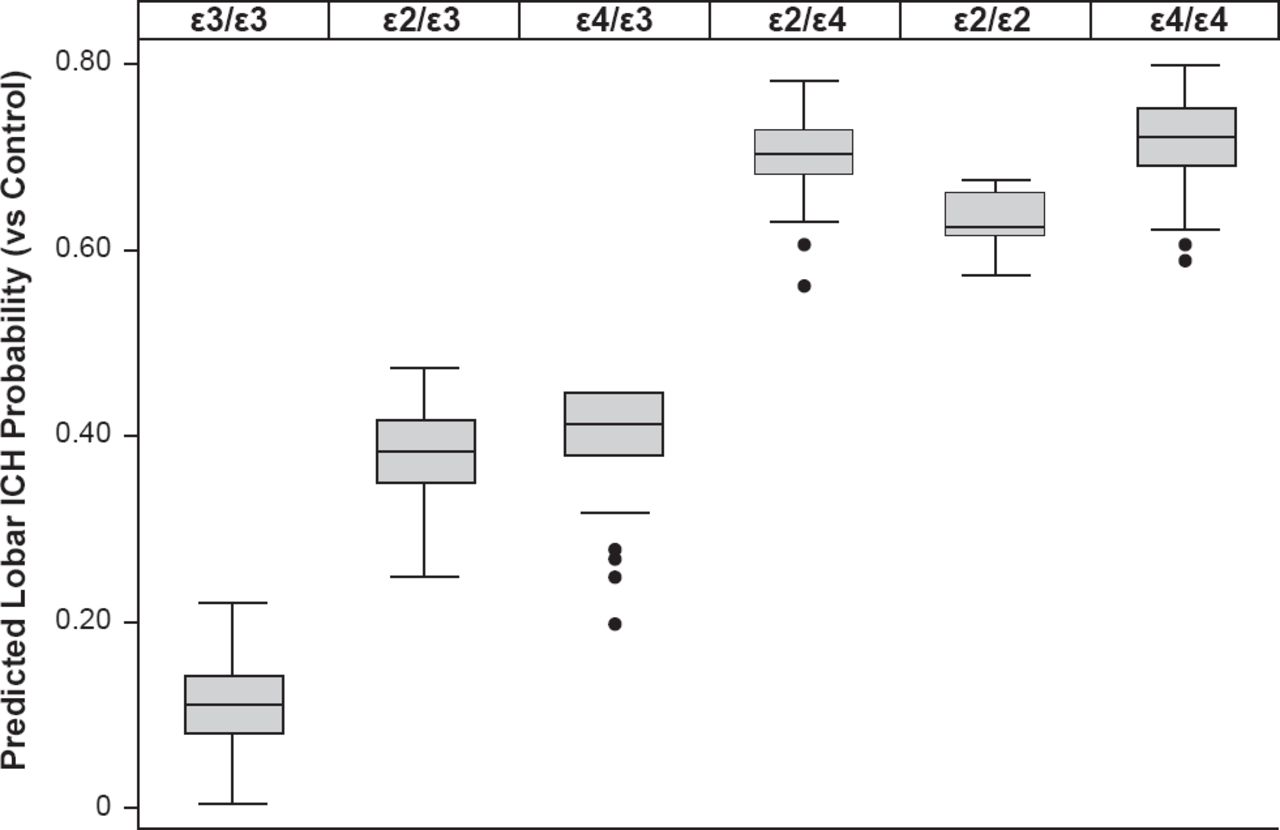
- Figure 4.
Impact of Variants at APOE on ICH Probability
ICH=intracerebral hemorrhage.
Reproduced from Biffi A et al. Variants at APOE influence risk of deep and lobar intracerebral hemorrhage. Ann Neurol 2010;68(6):934–943. With permission from John Wiley & Sons, Inc.
The editors would like to thank the many members of the International Stroke Conference presenting faculty who generously gave their time to ensure the accuracy and quality of the articles in this publication.


Tools


Table of contents
Cited By...
- No citing articles found.